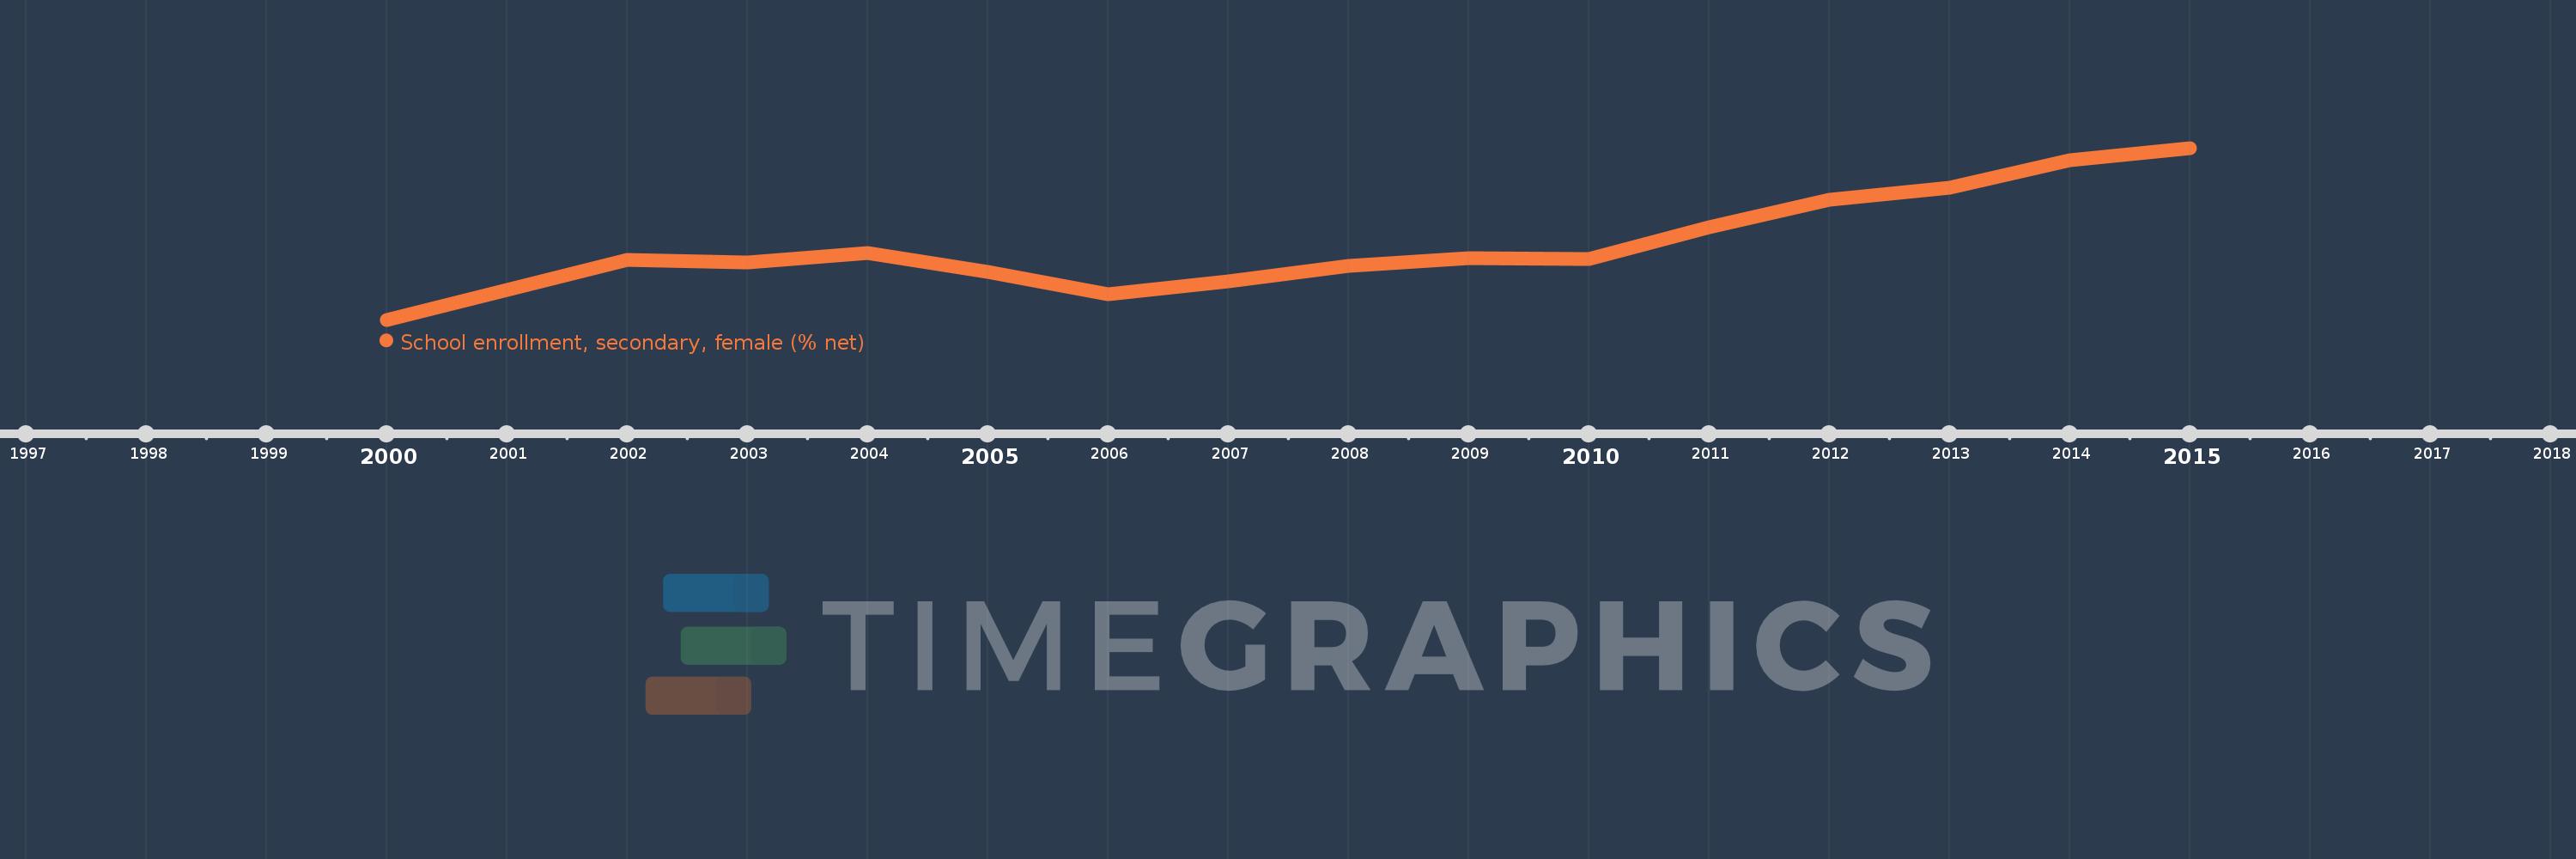
Questa scala temporale mostra un grafico dal 2000 anno al 2015 anno. Europe & Central Asia (excluding high income). I dati fino ad 1999 anno non disponibili. Il numero di osservazioni attuali secondo i date: 16.
La fonte (nome):
Indicatori dello sviluppo mondiale
La fonte (organizzazione):
United Nations Educational, Scientific, and Cultural Organization (UNESCO) Institute for Statistics.
Categorie:
Education, Gender
sono stati aggiornati
23 apr 2017 anni
Indicatori delle variazioni dei valori per anni
In media:
82.105
Minima:
78.087
1 gen 2000 anni
Massimo:
87.477
1 gen 2015 anni
Alla data di osservazione
Valore
Variazione assoluta
La variazione rispetto al valore precedente
1 gen 2000 anni
78.087
+78.087
0.0%
1 gen 2001 anni
79.728
+1.641
2.1%
1 gen 2002 anni
81.365
+1.636
2.05%
1 gen 2003 anni
81.216
-0.149
-0.18%
1 gen 2004 anni
81.713
+0.498
0.61%
1 gen 2005 anni
80.713
-1.0
-1.22%
1 gen 2006 anni
79.459
-1.254
-1.55%
1 gen 2007 anni
80.168
+0.709
0.89%
1 gen 2008 anni
81.018
+0.85
1.06%
1 gen 2009 anni
81.452
+0.434
0.54%
1 gen 2010 anni
81.406
-0.046
-0.06%
1 gen 2011 anni
83.164
+1.758
2.16%
1 gen 2012 anni
84.647
+1.483
1.78%
1 gen 2013 anni
85.284
+0.636
0.75%
1 gen 2014 anni
86.783
+1.499
1.76%
1 gen 2015 anni
87.477
+0.694
0.8%
Classificazione dei paesi secondo i statistiche attuali per anni