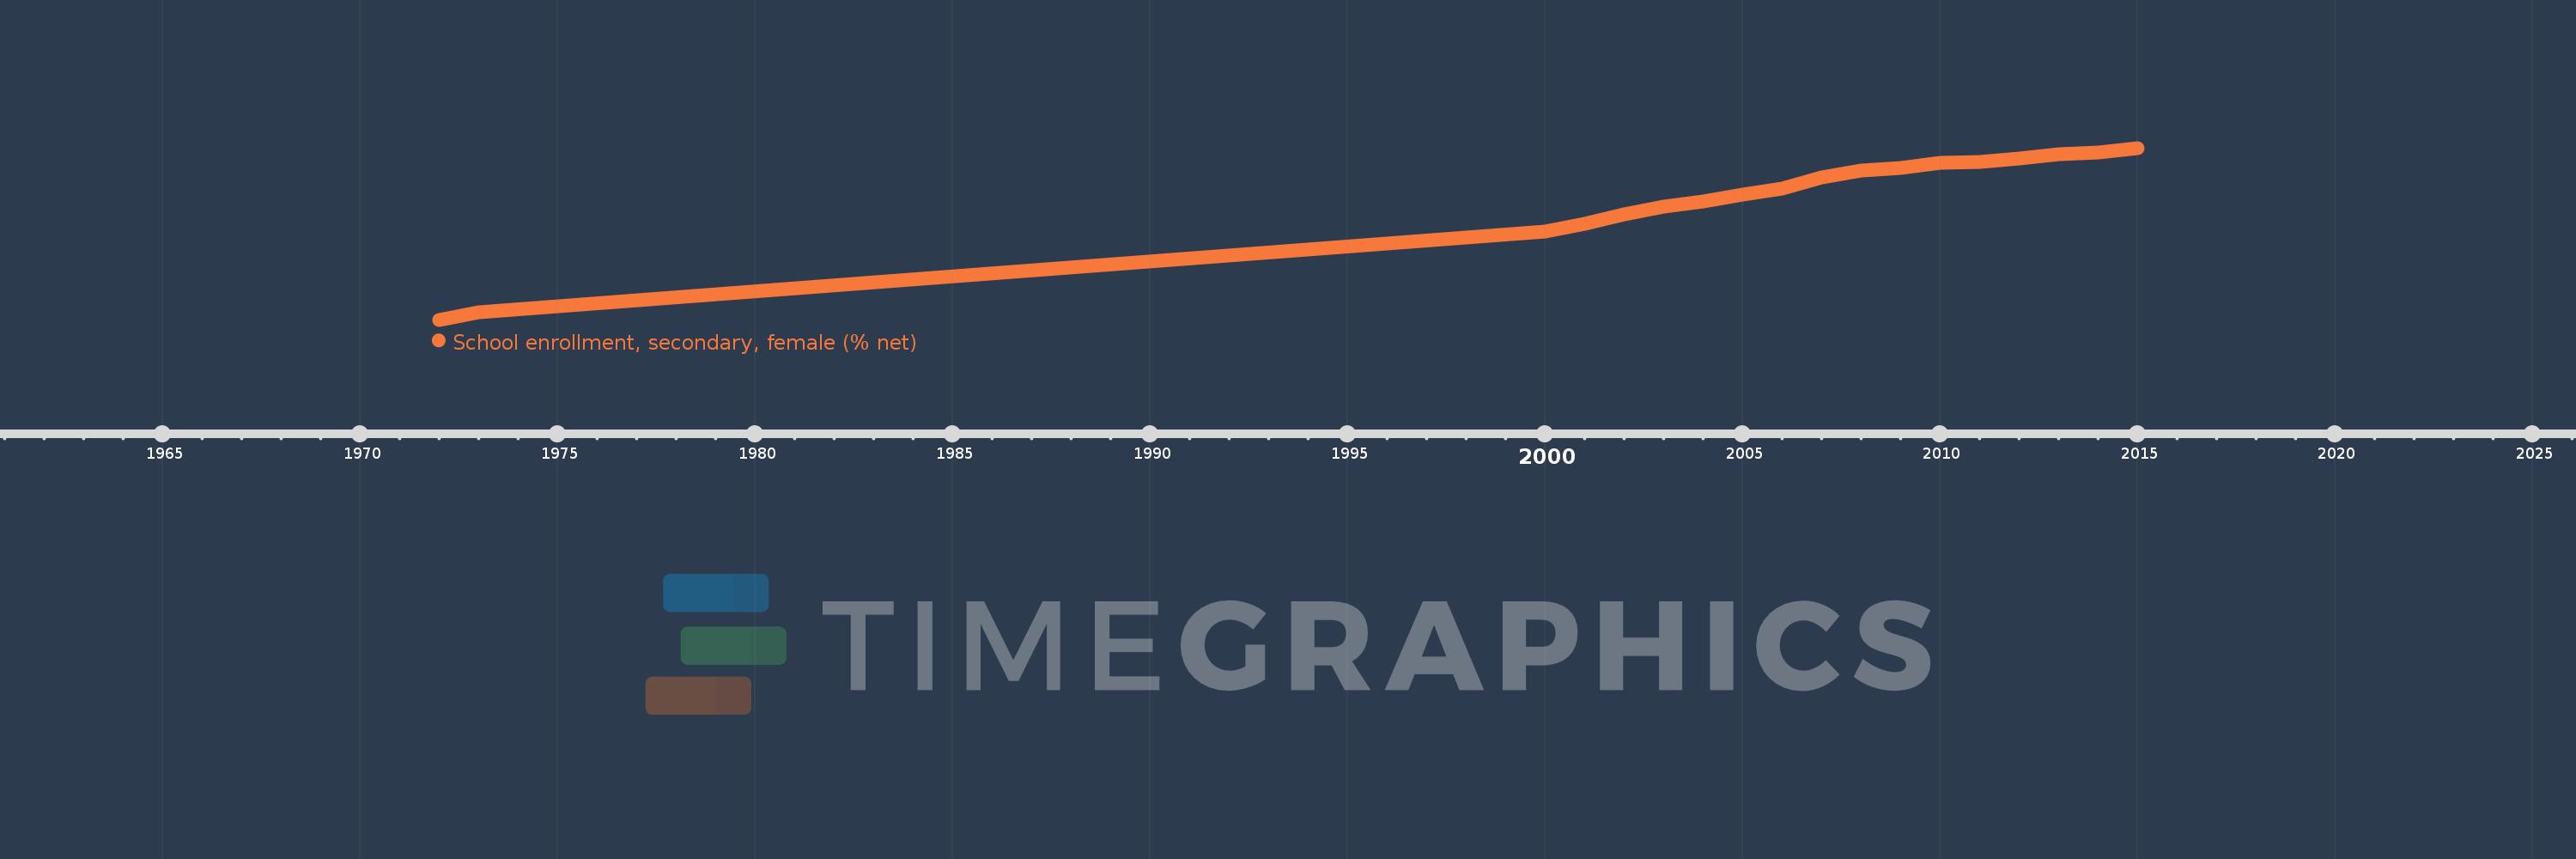
Questa scala temporale mostra un grafico dal 1972 anno al 2015 anno. Venezuela, RB. I dati fino ad 1971 anno non disponibili. Il numero di osservazioni attuali secondo i date: 18.
La fonte (nome):
Indicatori dello sviluppo mondiale
La fonte (organizzazione):
United Nations Educational, Scientific, and Cultural Organization (UNESCO) Institute for Statistics.
Categorie:
Education, Gender
sono stati aggiornati
23 apr 2017 anni
Indicatori delle variazioni dei valori per anni
In media:
63.541
Minima:
25.953
1 gen 1972 anni
Massimo:
78.538
1 gen 2015 anni
Alla data di osservazione
Valore
Variazione assoluta
La variazione rispetto al valore precedente
1 gen 1972 anni
25.953
+25.953
0.0%
1 gen 1973 anni
28.347
+2.395
9.23%
1 gen 2000 anni
52.93
+24.583
86.72%
1 gen 2001 anni
55.342
+2.412
4.56%
1 gen 2002 anni
58.247
+2.905
5.25%
1 gen 2003 anni
60.638
+2.391
4.1%
1 gen 2004 anni
62.087
+1.45
2.39%
1 gen 2005 anni
64.33
+2.243
3.61%
1 gen 2006 anni
66.115
+1.785
2.77%
1 gen 2007 anni
69.544
+3.429
5.19%
1 gen 2008 anni
71.709
+2.165
3.11%
1 gen 2009 anni
72.477
+0.768
1.07%
1 gen 2010 anni
73.898
+1.421
1.96%
1 gen 2011 anni
74.252
+0.354
0.48%
1 gen 2012 anni
75.399
+1.147
1.55%
1 gen 2013 anni
76.698
+1.299
1.72%
1 gen 2014 anni
77.236
+0.538
0.7%
1 gen 2015 anni
78.538
+1.302
1.69%
Classificazione dei paesi secondo i statistiche attuali per anni