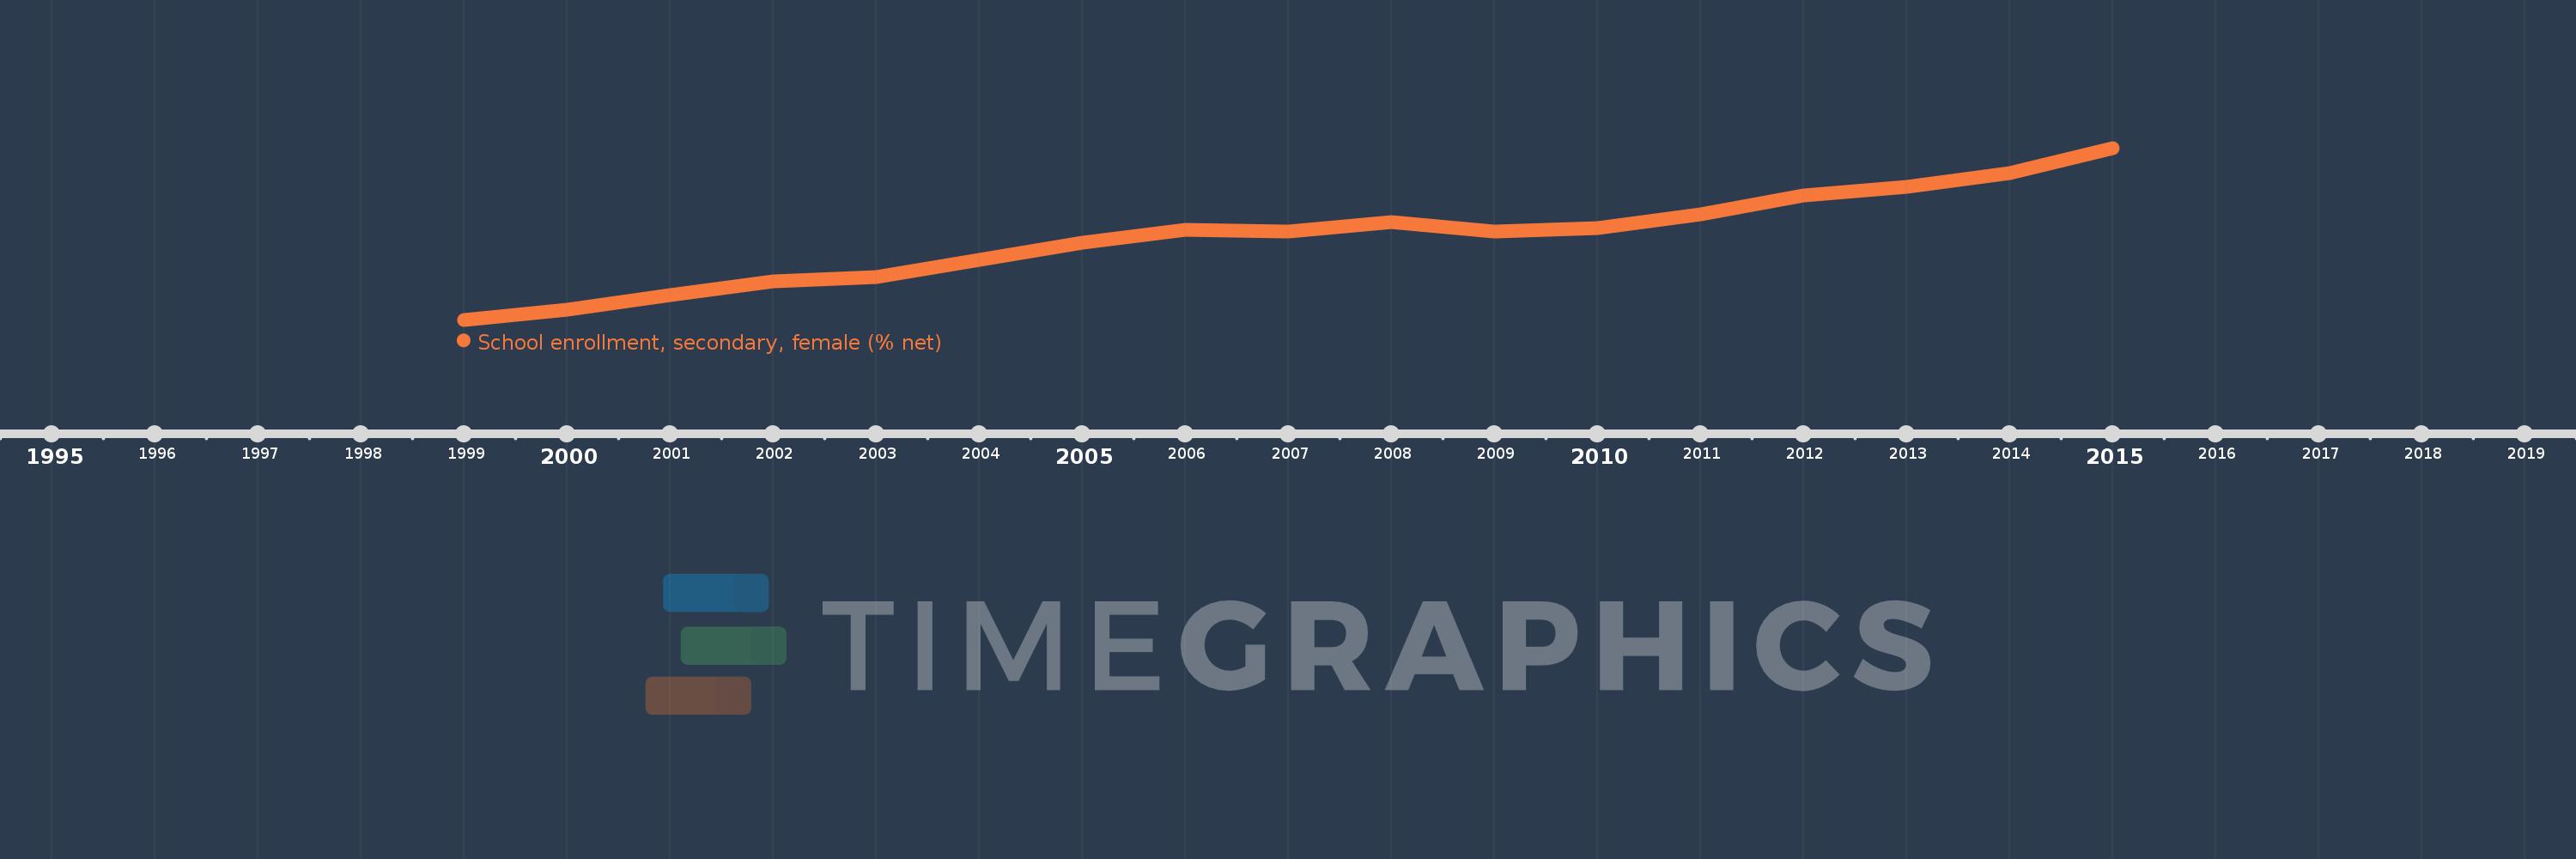
Questa scala temporale mostra un grafico dal 1999 anno al 2015 anno. East Asia & Pacific. I dati fino ad 1998 anno non disponibili. Il numero di osservazioni attuali secondo i date: 17.
La fonte (nome):
Indicatori dello sviluppo mondiale
La fonte (organizzazione):
United Nations Educational, Scientific, and Cultural Organization (UNESCO) Institute for Statistics.
Categorie:
Education, Gender
sono stati aggiornati
23 apr 2017 anni
Indicatori delle variazioni dei valori per anni
In media:
69.582
Minima:
61.152
1 gen 1999 anni
Massimo:
78.881
1 gen 2015 anni
Alla data di osservazione
Valore
Variazione assoluta
La variazione rispetto al valore precedente
1 gen 1999 anni
61.152
+61.152
0.0%
1 gen 2000 anni
62.183
+1.031
1.69%
1 gen 2001 anni
63.681
+1.498
2.41%
1 gen 2002 anni
65.146
+1.465
2.3%
1 gen 2003 anni
65.582
+0.436
0.67%
1 gen 2004 anni
67.312
+1.73
2.64%
1 gen 2005 anni
69.102
+1.79
2.66%
1 gen 2006 anni
70.416
+1.314
1.9%
1 gen 2007 anni
70.259
-0.157
-0.22%
1 gen 2008 anni
71.224
+0.965
1.37%
1 gen 2009 anni
70.261
-0.963
-1.35%
1 gen 2010 anni
70.645
+0.384
0.55%
1 gen 2011 anni
71.994
+1.349
1.91%
1 gen 2012 anni
73.95
+1.956
2.72%
1 gen 2013 anni
74.828
+0.878
1.19%
1 gen 2014 anni
76.278
+1.45
1.94%
1 gen 2015 anni
78.881
+2.603
3.41%
Classificazione dei paesi secondo i statistiche attuali per anni