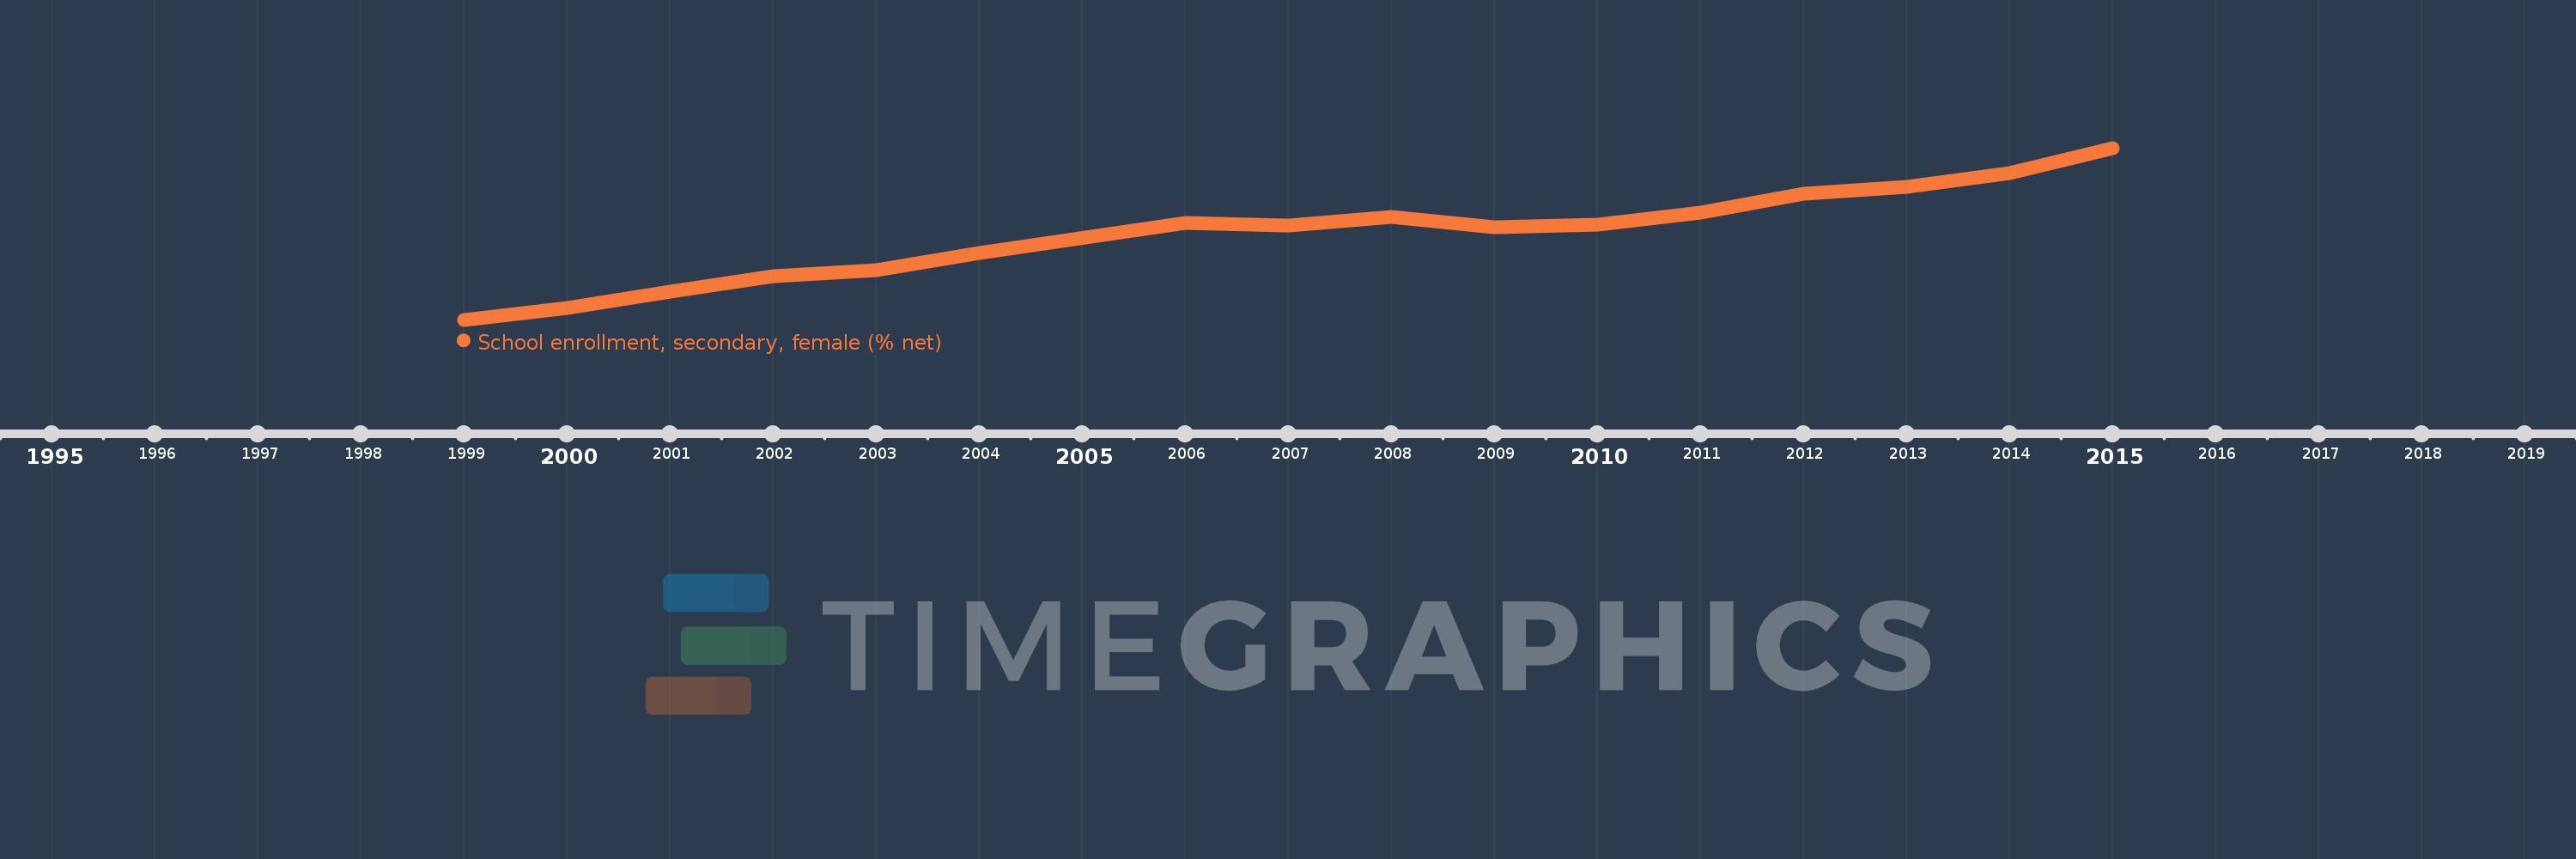
Questa scala temporale mostra un grafico dal 1999 anno al 2015 anno. East Asia & Pacific (IDA & IBRD countries). I dati fino ad 1998 anno non disponibili. Il numero di osservazioni attuali secondo i date: 16.
La fonte (nome):
Indicatori dello sviluppo mondiale
La fonte (organizzazione):
United Nations Educational, Scientific, and Cultural Organization (UNESCO) Institute for Statistics.
Categorie:
Education, Gender
sono stati aggiornati
23 apr 2017 anni
Indicatori delle variazioni dei valori per anni
In media:
67.298
Minima:
57.66
1 gen 1999 anni
Massimo:
77.055
1 gen 2015 anni
Alla data di osservazione
Valore
Variazione assoluta
La variazione rispetto al valore precedente
1 gen 1999 anni
57.66
+57.66
0.0%
1 gen 2000 anni
58.983
+1.324
2.3%
1 gen 2001 anni
60.783
+1.799
3.05%
1 gen 2002 anni
62.596
+1.813
2.98%
1 gen 2003 anni
63.246
+0.649
1.04%
1 gen 2004 anni
65.221
+1.976
3.12%
1 gen 2006 anni
68.552
+3.331
5.11%
1 gen 2007 anni
68.301
-0.25
-0.37%
1 gen 2008 anni
69.249
+0.947
1.39%
1 gen 2009 anni
68.119
-1.13
-1.63%
1 gen 2010 anni
68.419
+0.3
0.44%
1 gen 2011 anni
69.798
+1.379
2.02%
1 gen 2012 anni
71.857
+2.059
2.95%
1 gen 2013 anni
72.71
+0.853
1.19%
1 gen 2014 anni
74.218
+1.508
2.07%
1 gen 2015 anni
77.055
+2.837
3.82%
Classificazione dei paesi secondo i statistiche attuali per anni