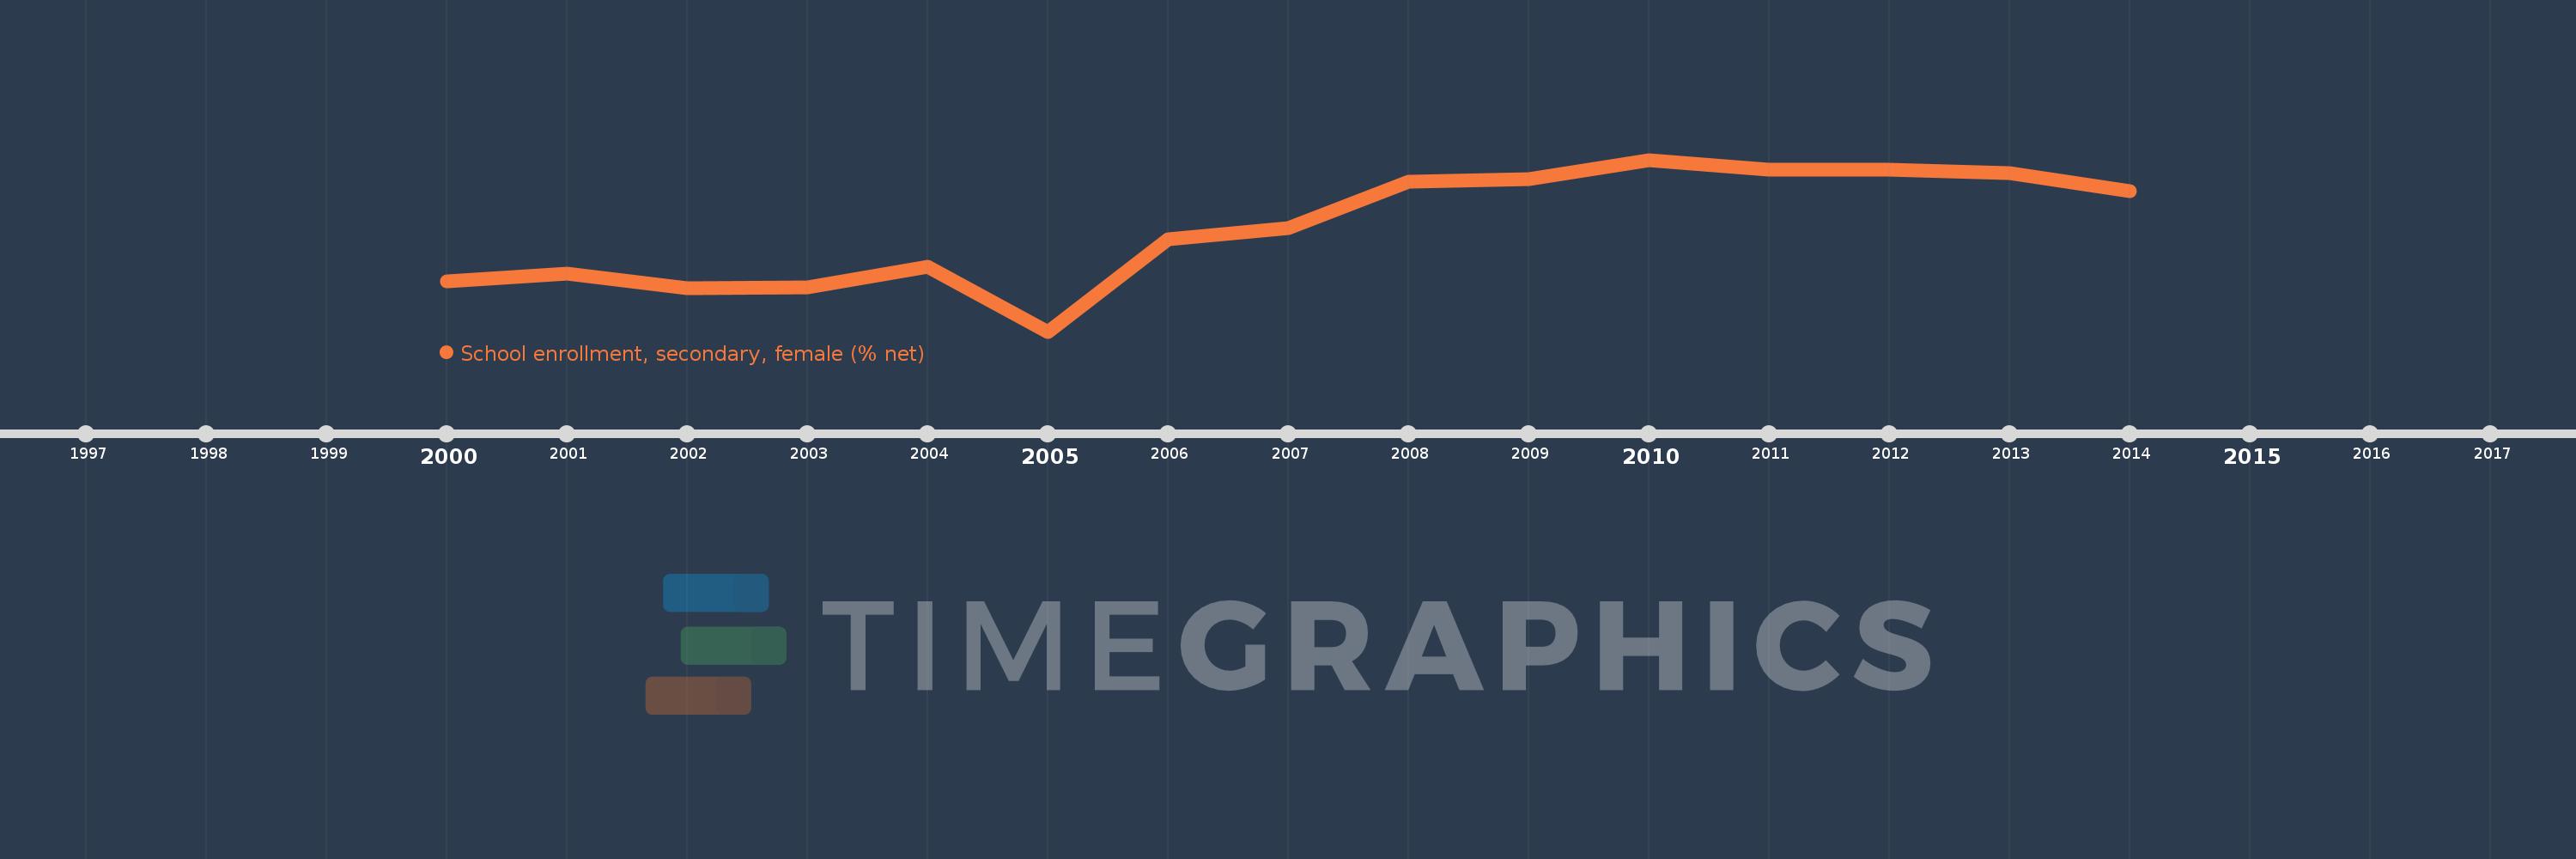
Questa scala temporale mostra un grafico dal 2000 anno al 2014 anno. St. Lucia. I dati fino ad 1999 anno non disponibili. Il numero di osservazioni attuali secondo i date: 15.
La fonte (nome):
Indicatori dello sviluppo mondiale
La fonte (organizzazione):
United Nations Educational, Scientific, and Cultural Organization (UNESCO) Institute for Statistics.
Categorie:
Education, Gender
sono stati aggiornati
23 apr 2017 anni
Indicatori delle variazioni dei valori per anni
In media:
75.945
Minima:
61.388
1 gen 2005 anni
Massimo:
85.545
1 gen 2010 anni
Alla data di osservazione
Valore
Variazione assoluta
La variazione rispetto al valore precedente
1 gen 2000 anni
68.405
+68.405
0.0%
1 gen 2001 anni
69.505
+1.1
1.61%
1 gen 2002 anni
67.531
-1.974
-2.84%
1 gen 2003 anni
67.558
+0.027
0.04%
1 gen 2004 anni
70.525
+2.967
4.39%
1 gen 2005 anni
61.388
-9.137
-12.96%
1 gen 2006 anni
74.312
+12.924
21.05%
1 gen 2007 anni
75.99
+1.679
2.26%
1 gen 2008 anni
82.417
+6.427
8.46%
1 gen 2009 anni
82.802
+0.384
0.47%
1 gen 2010 anni
85.545
+2.744
3.31%
1 gen 2011 anni
84.204
-1.341
-1.57%
1 gen 2012 anni
84.207
+0.003
0.0%
1 gen 2013 anni
83.637
-0.57
-0.68%
1 gen 2014 anni
81.156
-2.481
-2.97%
Classificazione dei paesi secondo i statistiche attuali per anni