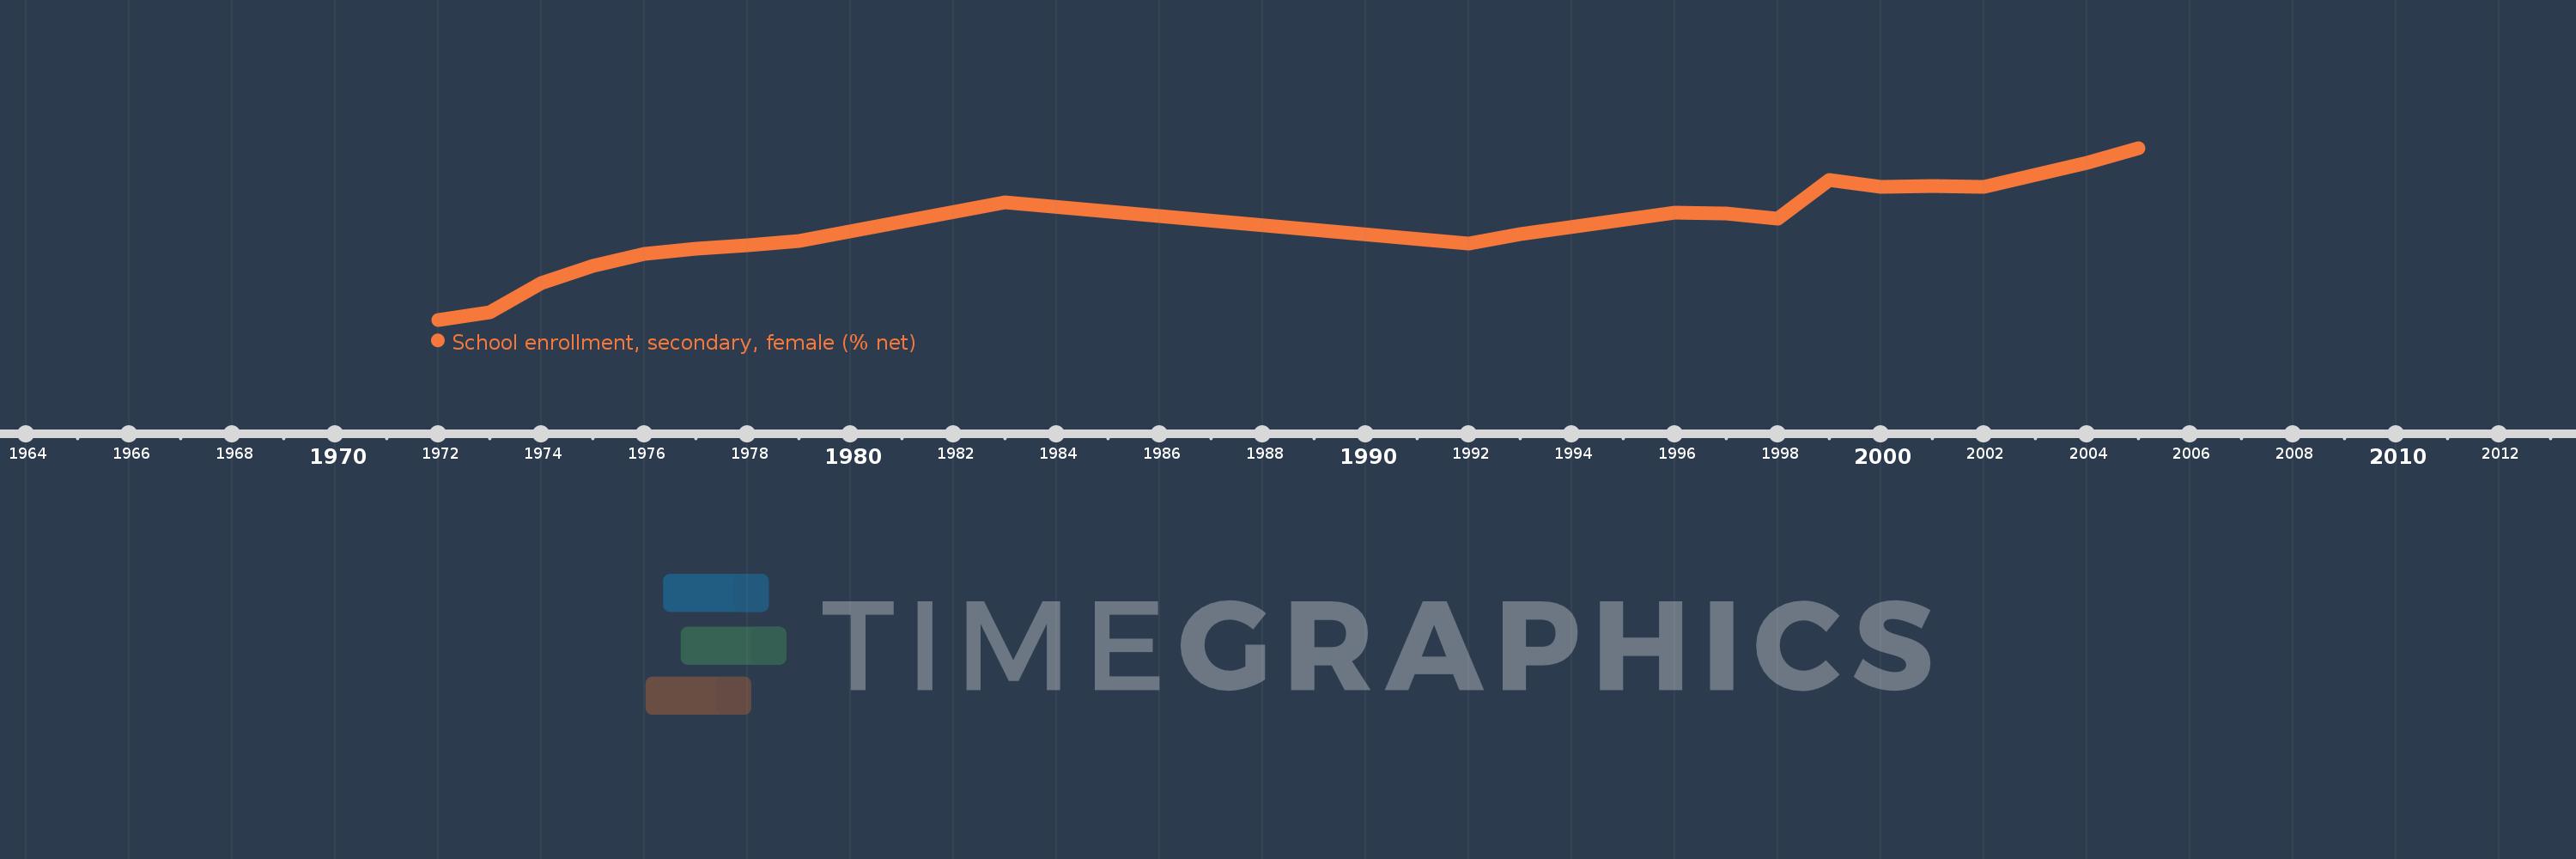
Questa scala temporale mostra un grafico dal 1972 anno al 2005 anno. Ireland. I dati fino ad 1971 anno non disponibili. Il numero di osservazioni attuali secondo i date: 21.
La fonte (nome):
Indicatori dello sviluppo mondiale
La fonte (organizzazione):
United Nations Educational, Scientific, and Cultural Organization (UNESCO) Institute for Statistics.
Categorie:
Education, Gender
sono stati aggiornati
23 apr 2017 anni
Indicatori delle variazioni dei valori per anni
In media:
81.311
Minima:
64.917
1 gen 1972 anni
Massimo:
94.546
1 gen 2005 anni
Alla data di osservazione
Valore
Variazione assoluta
La variazione rispetto al valore precedente
1 gen 1972 anni
64.917
+64.917
0.0%
1 gen 1973 anni
66.149
+1.232
1.9%
1 gen 1974 anni
71.294
+5.145
7.78%
1 gen 1975 anni
74.213
+2.919
4.09%
1 gen 1976 anni
76.256
+2.043
2.75%
1 gen 1977 anni
77.18
+0.923
1.21%
1 gen 1978 anni
77.733
+0.553
0.72%
1 gen 1979 anni
78.526
+0.794
1.02%
1 gen 1983 anni
85.233
+6.707
8.54%
1 gen 1992 anni
78.008
-7.225
-8.48%
1 gen 1993 anni
79.697
+1.688
2.16%
1 gen 1996 anni
83.388
+3.691
4.63%
1 gen 1997 anni
83.285
-0.103
-0.12%
1 gen 1998 anni
82.411
-0.875
-1.05%
1 gen 1999 anni
89.059
+6.648
8.07%
1 gen 2000 anni
87.816
-1.243
-1.4%
1 gen 2001 anni
88.01
+0.194
0.22%
1 gen 2002 anni
87.862
-0.148
-0.17%
1 gen 2003 anni
89.915
+2.053
2.34%
1 gen 2004 anni
92.028
+2.113
2.35%
1 gen 2005 anni
94.546
+2.518
2.74%
Classificazione dei paesi secondo i statistiche attuali per anni