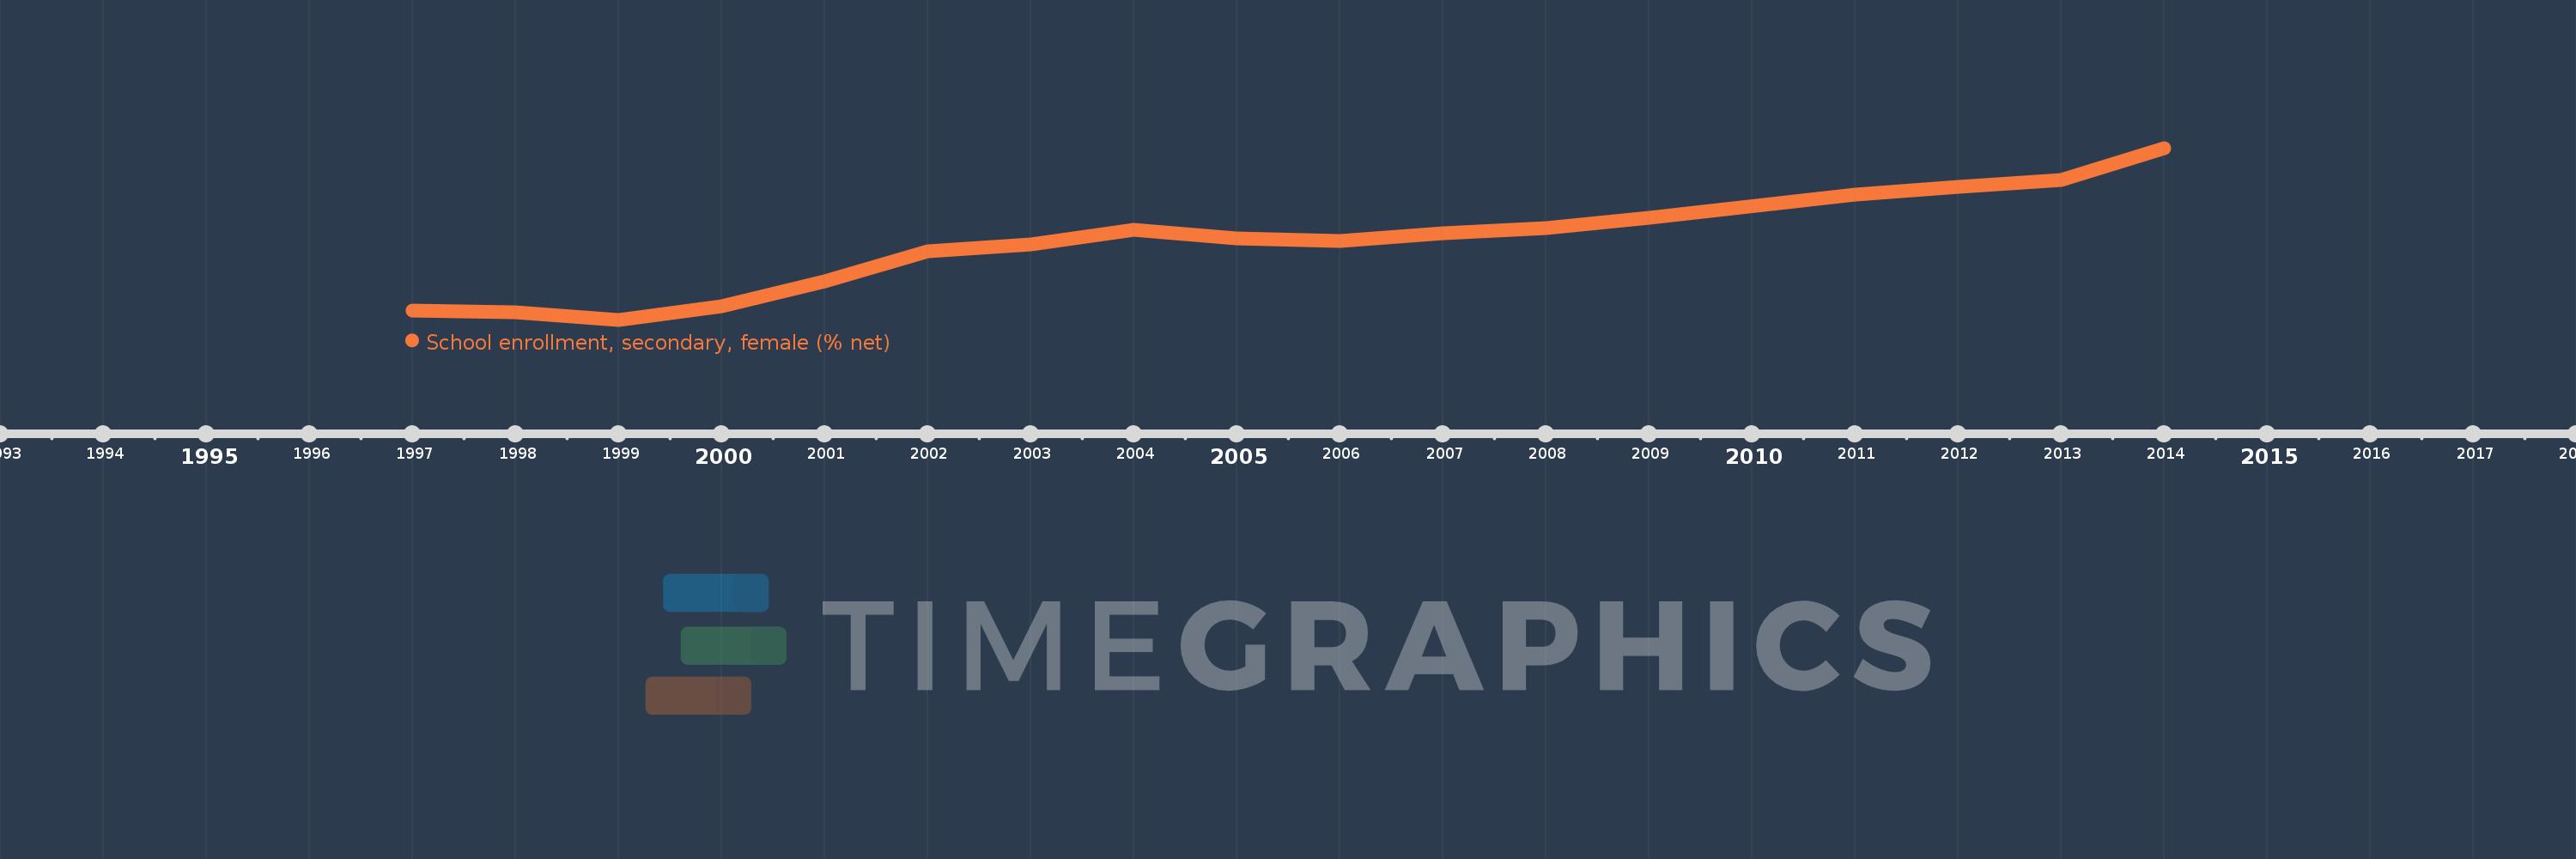
Questa scala temporale mostra un grafico dal 1997 anno al 2014 anno. Europe & Central Asia. I dati fino ad 1996 anno non disponibili. Il numero di osservazioni attuali secondo i date: 17.
La fonte (nome):
Indicatori dello sviluppo mondiale
La fonte (organizzazione):
United Nations Educational, Scientific, and Cultural Organization (UNESCO) Institute for Statistics.
Categorie:
Education, Gender
sono stati aggiornati
23 apr 2017 anni
Indicatori delle variazioni dei valori per anni
In media:
85.579
Minima:
82.284
1 gen 1999 anni
Massimo:
89.624
1 gen 2014 anni
Alla data di osservazione
Valore
Variazione assoluta
La variazione rispetto al valore precedente
1 gen 1997 anni
82.666
+82.666
0.0%
1 gen 1998 anni
82.606
-0.06
-0.07%
1 gen 1999 anni
82.284
-0.322
-0.39%
1 gen 2000 anni
82.859
+0.575
0.7%
1 gen 2001 anni
83.92
+1.06
1.28%
1 gen 2002 anni
85.201
+1.281
1.53%
1 gen 2003 anni
85.506
+0.305
0.36%
1 gen 2004 anni
86.126
+0.619
0.72%
1 gen 2005 anni
85.768
-0.358
-0.42%
1 gen 2006 anni
85.638
-0.13
-0.15%
1 gen 2007 anni
85.963
+0.325
0.38%
1 gen 2008 anni
86.189
+0.227
0.26%
1 gen 2009 anni
86.655
+0.466
0.54%
1 gen 2011 anni
87.631
+0.976
1.13%
1 gen 2012 anni
87.959
+0.328
0.37%
1 gen 2013 anni
88.255
+0.296
0.34%
1 gen 2014 anni
89.624
+1.37
1.55%
Classificazione dei paesi secondo i statistiche attuali per anni