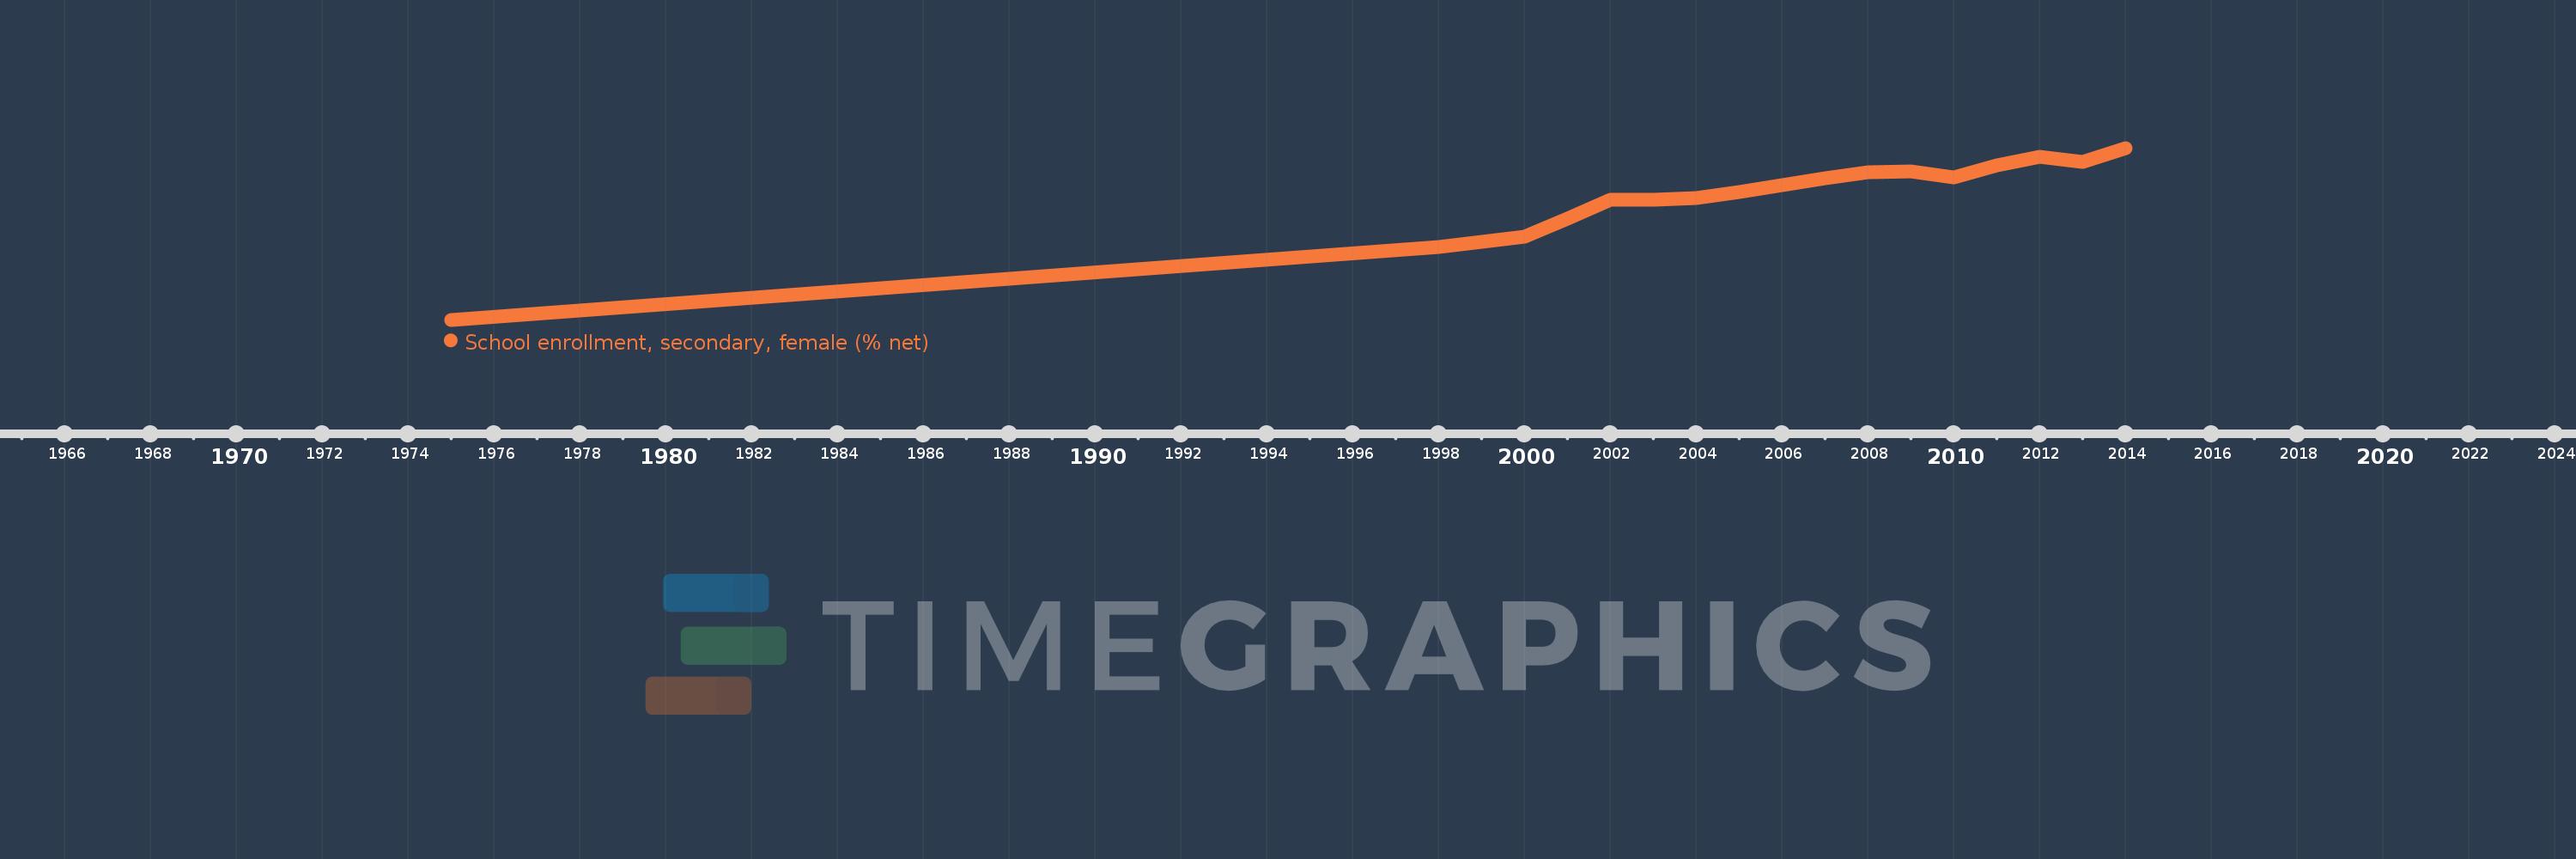
Questa scala temporale mostra un grafico dal 1975 anno al 2014 anno. Turkey. I dati fino ad 1974 anno non disponibili. Il numero di osservazioni attuali secondo i date: 17.
La fonte (nome):
Indicatori dello sviluppo mondiale
La fonte (organizzazione):
United Nations Educational, Scientific, and Cultural Organization (UNESCO) Institute for Statistics.
Categorie:
Education, Gender
sono stati aggiornati
23 apr 2017 anni
Indicatori delle variazioni dei valori per anni
In media:
65.583
Minima:
14.65
1 gen 1975 anni
Massimo:
85.23
1 gen 2014 anni
Alla data di osservazione
Valore
Variazione assoluta
La variazione rispetto al valore precedente
1 gen 1975 anni
14.65
+14.65
0.0%
1 gen 1998 anni
44.441
+29.791
203.35%
1 gen 2000 anni
48.935
+4.494
10.11%
1 gen 2001 anni
56.089
+7.154
14.62%
1 gen 2002 anni
64.085
+7.996
14.26%
1 gen 2003 anni
64.025
-0.06
-0.09%
1 gen 2004 anni
64.567
+0.543
0.85%
1 gen 2005 anni
67.115
+2.548
3.95%
1 gen 2006 anni
70.035
+2.92
4.35%
1 gen 2007 anni
72.917
+2.882
4.12%
1 gen 2008 anni
75.072
+2.155
2.96%
1 gen 2009 anni
75.559
+0.487
0.65%
1 gen 2010 anni
73.291
-2.267
-3.0%
1 gen 2011 anni
78.004
+4.712
6.43%
1 gen 2012 anni
81.448
+3.444
4.41%
1 gen 2013 anni
79.455
-1.992
-2.45%
1 gen 2014 anni
85.23
+5.774
7.27%
Classificazione dei paesi secondo i statistiche attuali per anni