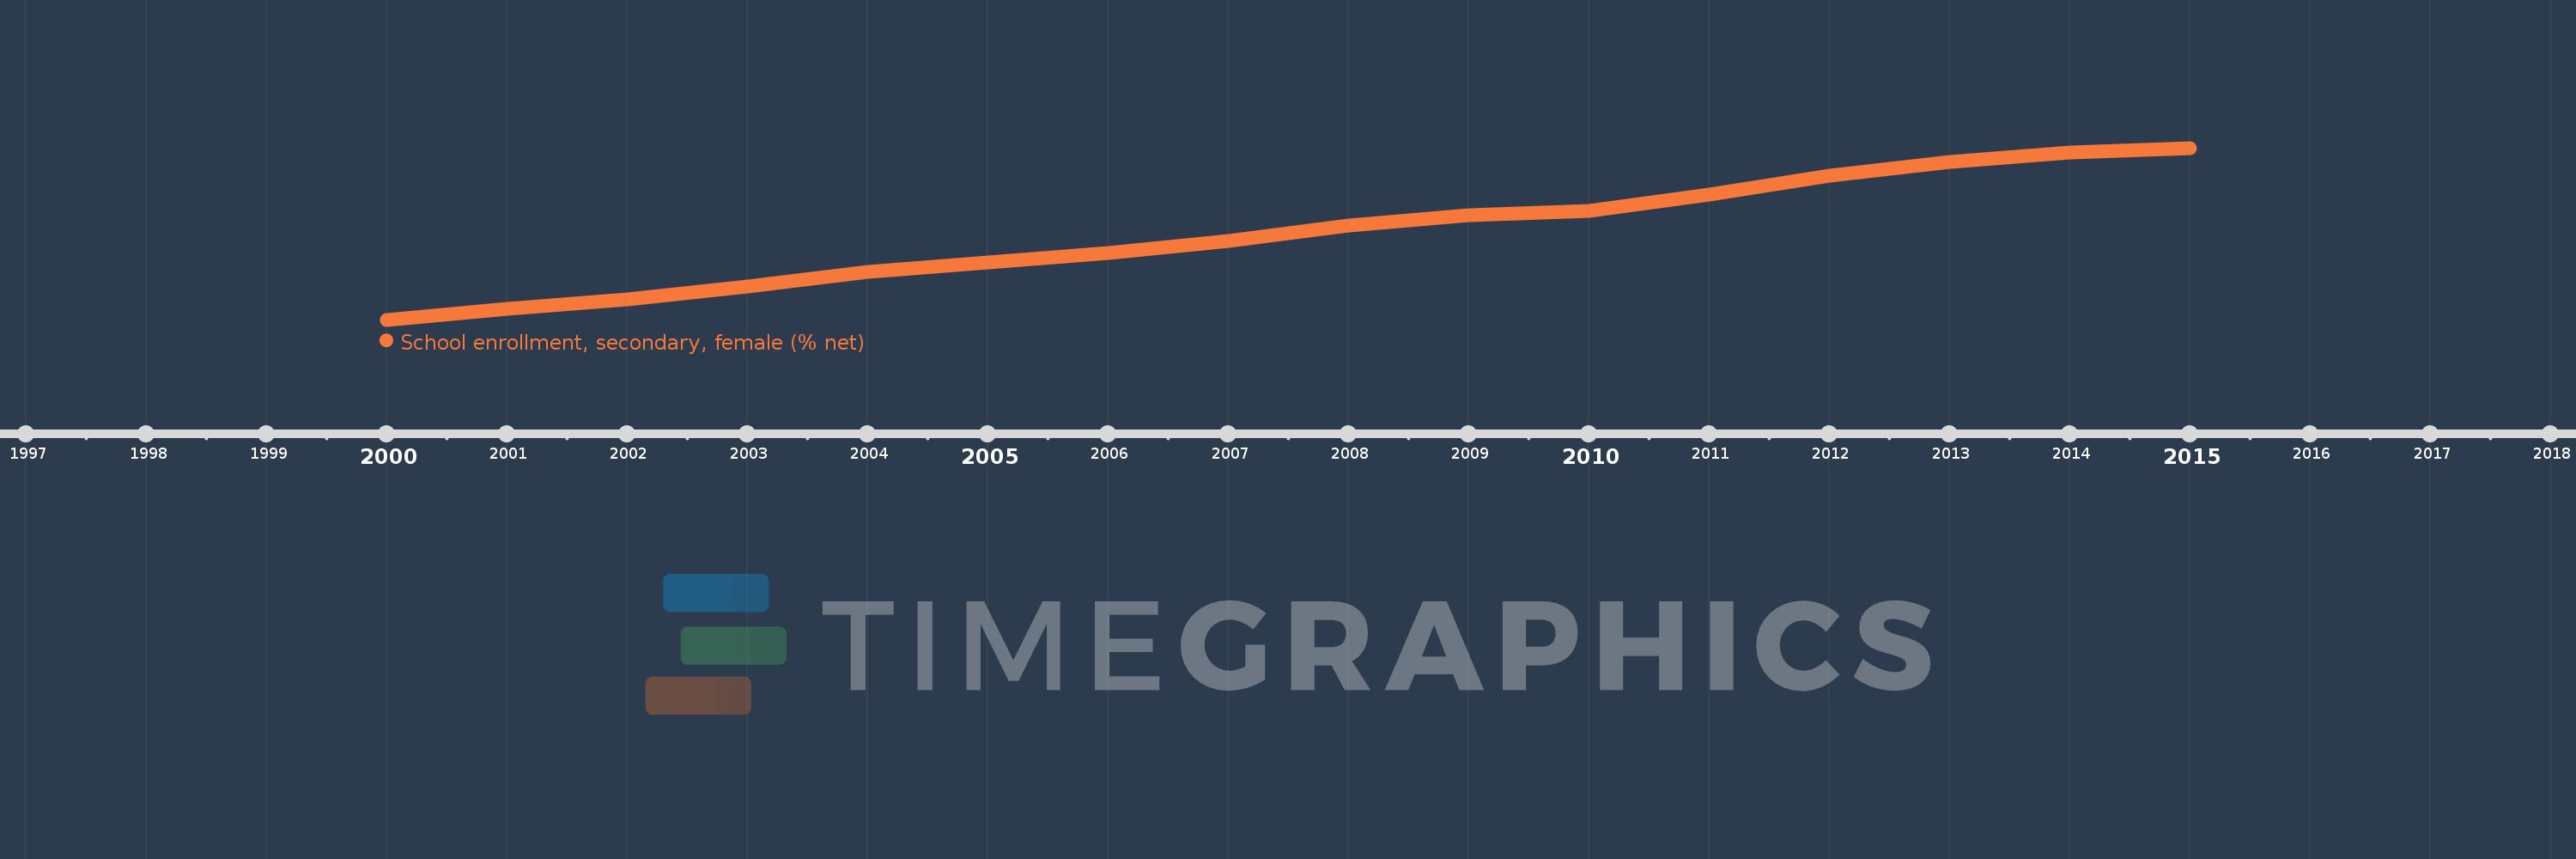
Questa scala temporale mostra un grafico dal 2000 anno al 2015 anno. Early-demographic dividend. I dati fino ad 1999 anno non disponibili. Il numero di osservazioni attuali secondo i date: 16.
La fonte (nome):
Indicatori dello sviluppo mondiale
La fonte (organizzazione):
United Nations Educational, Scientific, and Cultural Organization (UNESCO) Institute for Statistics.
Categorie:
Education, Gender
sono stati aggiornati
23 apr 2017 anni
Indicatori delle variazioni dei valori per anni
In media:
51.021
Minima:
39.586
1 gen 2000 anni
Massimo:
62.237
1 gen 2015 anni
Alla data di osservazione
Valore
Variazione assoluta
La variazione rispetto al valore precedente
1 gen 2000 anni
39.586
+39.586
0.0%
1 gen 2001 anni
40.969
+1.383
3.49%
1 gen 2002 anni
42.241
+1.271
3.1%
1 gen 2003 anni
43.93
+1.689
4.0%
1 gen 2004 anni
45.86
+1.931
4.39%
1 gen 2005 anni
47.117
+1.257
2.74%
1 gen 2006 anni
48.41
+1.292
2.74%
1 gen 2007 anni
49.974
+1.565
3.23%
1 gen 2008 anni
51.977
+2.002
4.01%
1 gen 2009 anni
53.413
+1.436
2.76%
1 gen 2010 anni
53.943
+0.531
0.99%
1 gen 2011 anni
56.108
+2.165
4.01%
1 gen 2012 anni
58.554
+2.446
4.36%
1 gen 2013 anni
60.359
+1.805
3.08%
1 gen 2014 anni
61.651
+1.292
2.14%
1 gen 2015 anni
62.237
+0.586
0.95%
Classificazione dei paesi secondo i statistiche attuali per anni