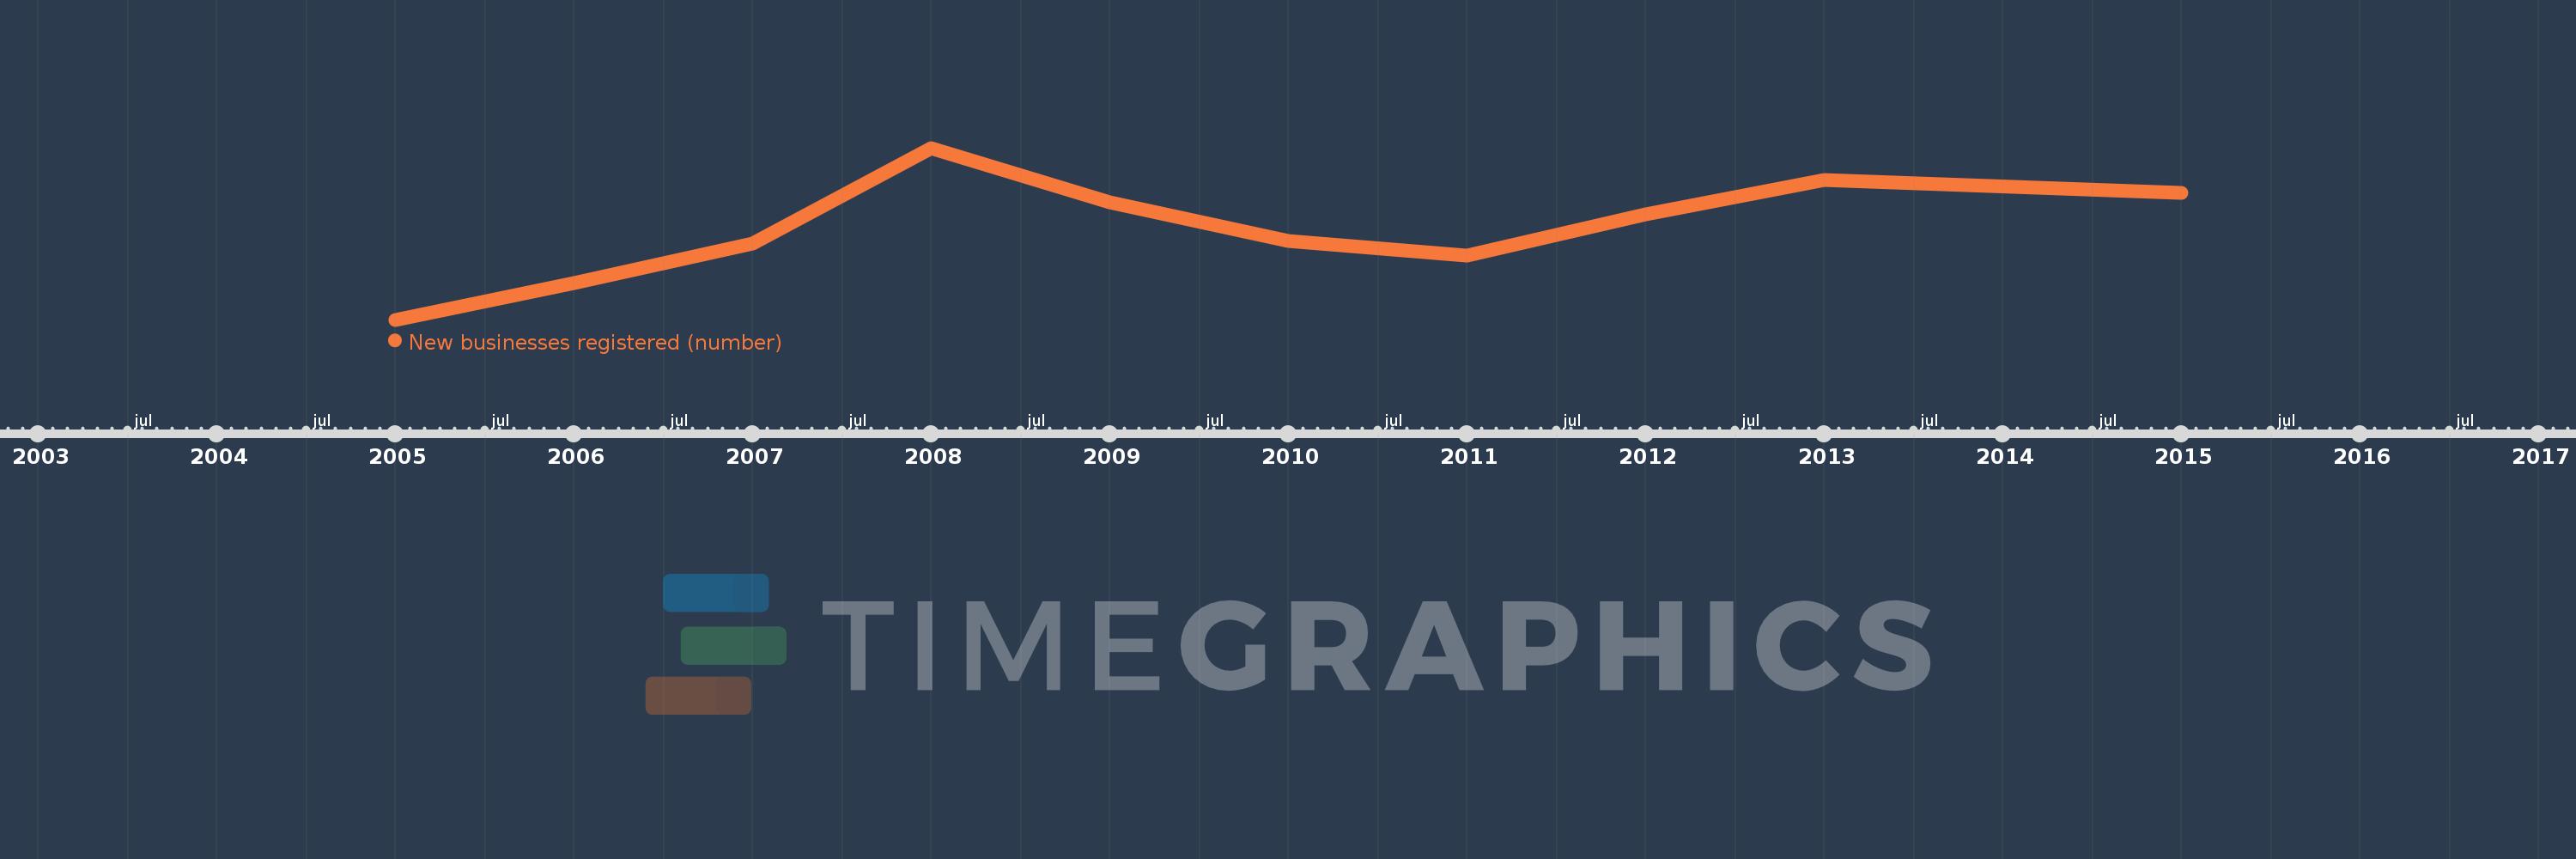
Questa scala temporale mostra un grafico dal 2005 anno al 2015 anno. Bulgaria. I dati fino ad 2004 anno non disponibili. Il numero di osservazioni attuali secondo i date: 10.
La fonte (nome):
Indicatori dello sviluppo mondiale
La fonte (organizzazione):
World Bank's Entrepreneurship Survey and database (http://econ.worldbank.org/research/entrepreneurship).
Categorie:
Private Sector
sono stati aggiornati
23 apr 2017 anni
Indicatori delle variazioni dei valori per anni
In media:
37.432 Mille.
Minima:
23.838 Mille.
1 gen 2005 anni
Massimo:
49.328 Mille.
1 gen 2008 anni
Alla data di osservazione
Valore
Variazione assoluta
La variazione rispetto al valore precedente
1 gen 2005 anni
23.838 Mille.
+23.838 Mille.
0.0%
1 gen 2006 anni
29.338 Mille.
+5.5 Mille.
23.07%
1 gen 2007 anni
35.098 Mille.
+5.76 Mille.
19.63%
1 gen 2008 anni
49.328 Mille.
+14.23 Mille.
40.54%
1 gen 2009 anni
41.218 Mille.
-8.11 Mille.
-16.44%
1 gen 2010 anni
35.57 Mille.
-5.648 Mille.
-13.7%
1 gen 2011 anni
33.3 Mille.
-2.27 Mille.
-6.38%
1 gen 2012 anni
39.476 Mille.
+6.176 Mille.
18.55%
1 gen 2013 anni
44.537 Mille.
+5.061 Mille.
12.82%
1 gen 2015 anni
42.613 Mille.
-1.924 Mille.
-4.32%
Classificazione dei paesi secondo i statistiche attuali per anni