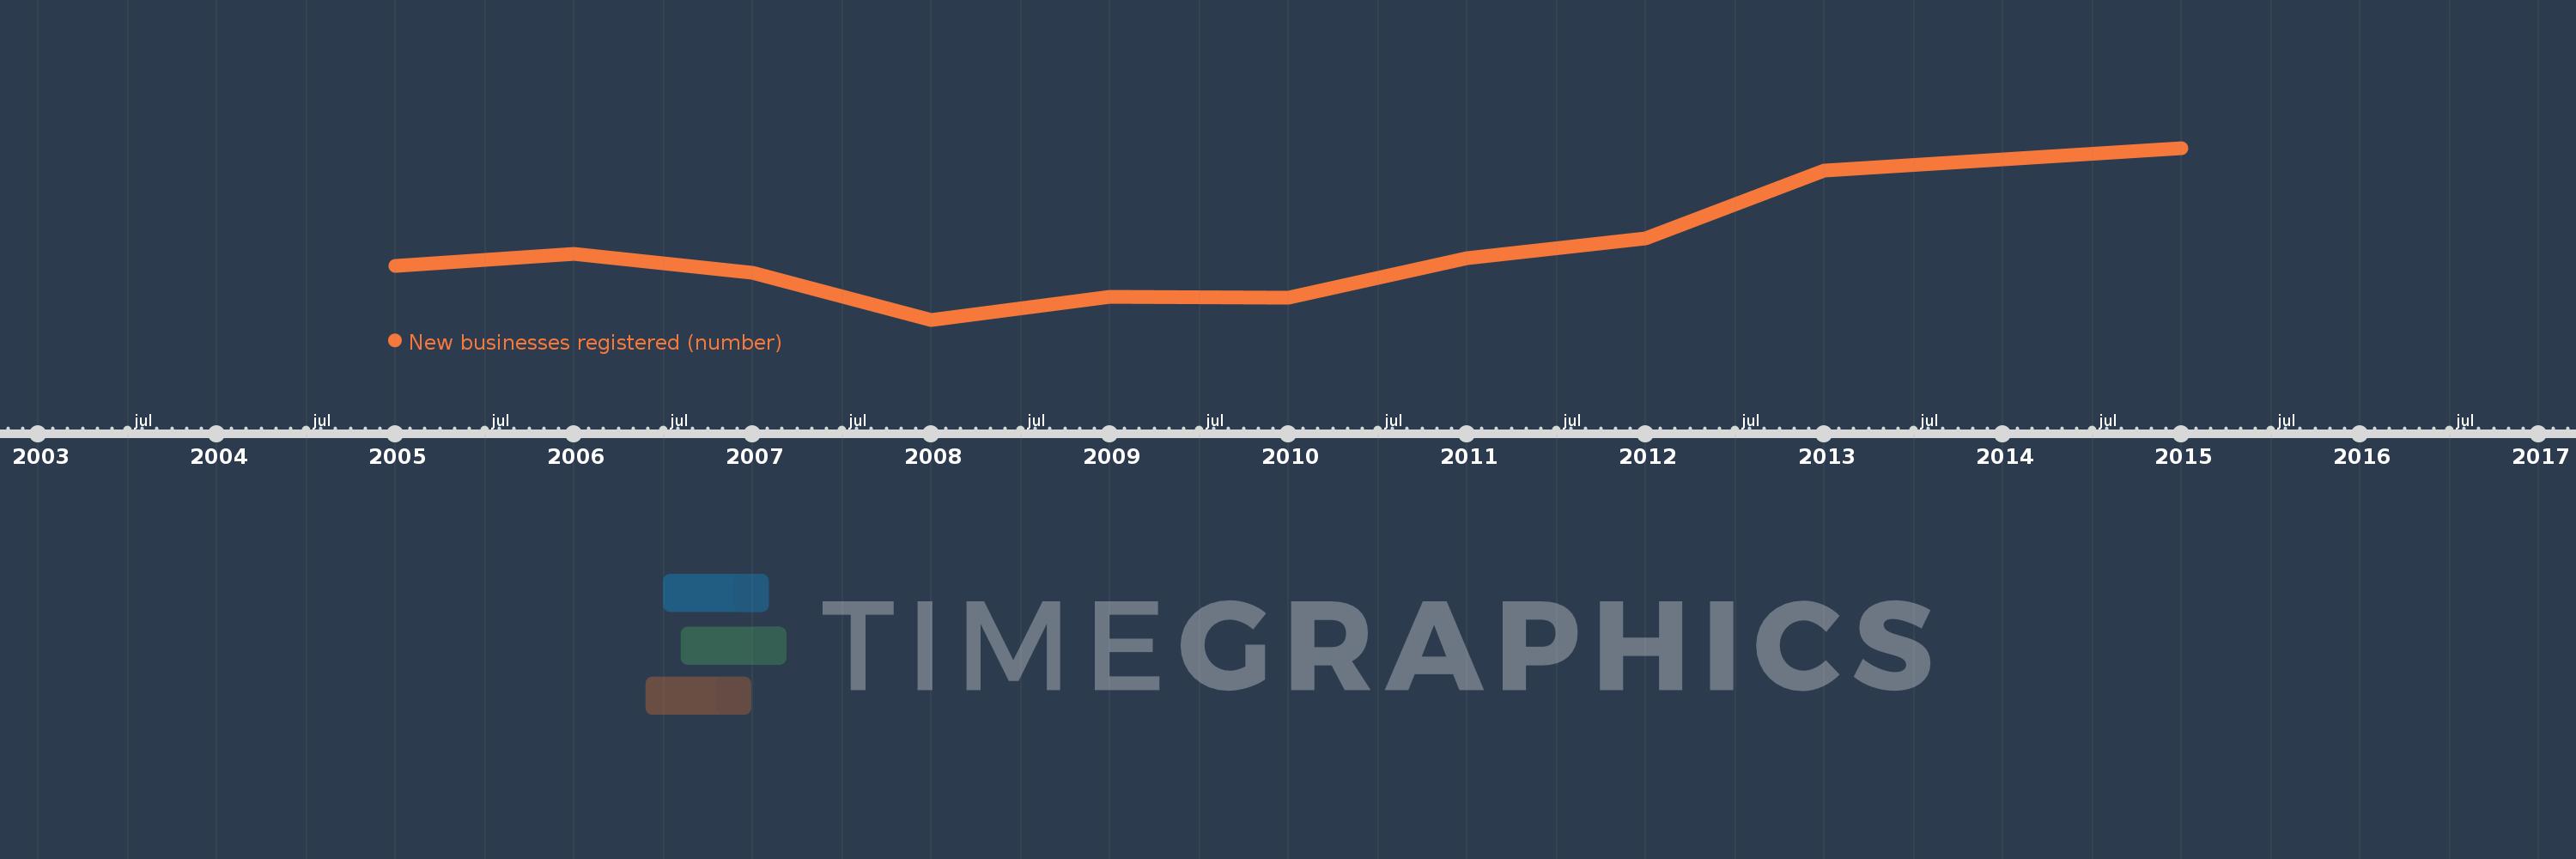
Questa scala temporale mostra un grafico dal 2005 anno al 2015 anno. Thailand. I dati fino ad 2004 anno non disponibili. Il numero di osservazioni attuali secondo i date: 10.
La fonte (nome):
Indicatori dello sviluppo mondiale
La fonte (organizzazione):
World Bank's Entrepreneurship Survey and database (http://econ.worldbank.org/research/entrepreneurship).
Categorie:
Private Sector
sono stati aggiornati
23 apr 2017 anni
Indicatori delle variazioni dei valori per anni
In media:
32.457 Mille.
Minima:
25.241 Mille.
1 gen 2008 anni
Massimo:
43.589 Mille.
1 gen 2015 anni
Alla data di osservazione
Valore
Variazione assoluta
La variazione rispetto al valore precedente
1 gen 2005 anni
31.037 Mille.
+31.037 Mille.
0.0%
1 gen 2006 anni
32.243 Mille.
+1.206 Mille.
3.89%
1 gen 2007 anni
30.235 Mille.
-2.008 Mille.
-6.23%
1 gen 2008 anni
25.241 Mille.
-4.994 Mille.
-16.52%
1 gen 2009 anni
27.68 Mille.
+2.439 Mille.
9.66%
1 gen 2010 anni
27.587 Mille.
-93.0
-0.34%
1 gen 2011 anni
31.806 Mille.
+4.219 Mille.
15.29%
1 gen 2012 anni
33.94 Mille.
+2.134 Mille.
6.71%
1 gen 2013 anni
41.21 Mille.
+7.27 Mille.
21.42%
1 gen 2015 anni
43.589 Mille.
+2.379 Mille.
5.77%
Classificazione dei paesi secondo i statistiche attuali per anni