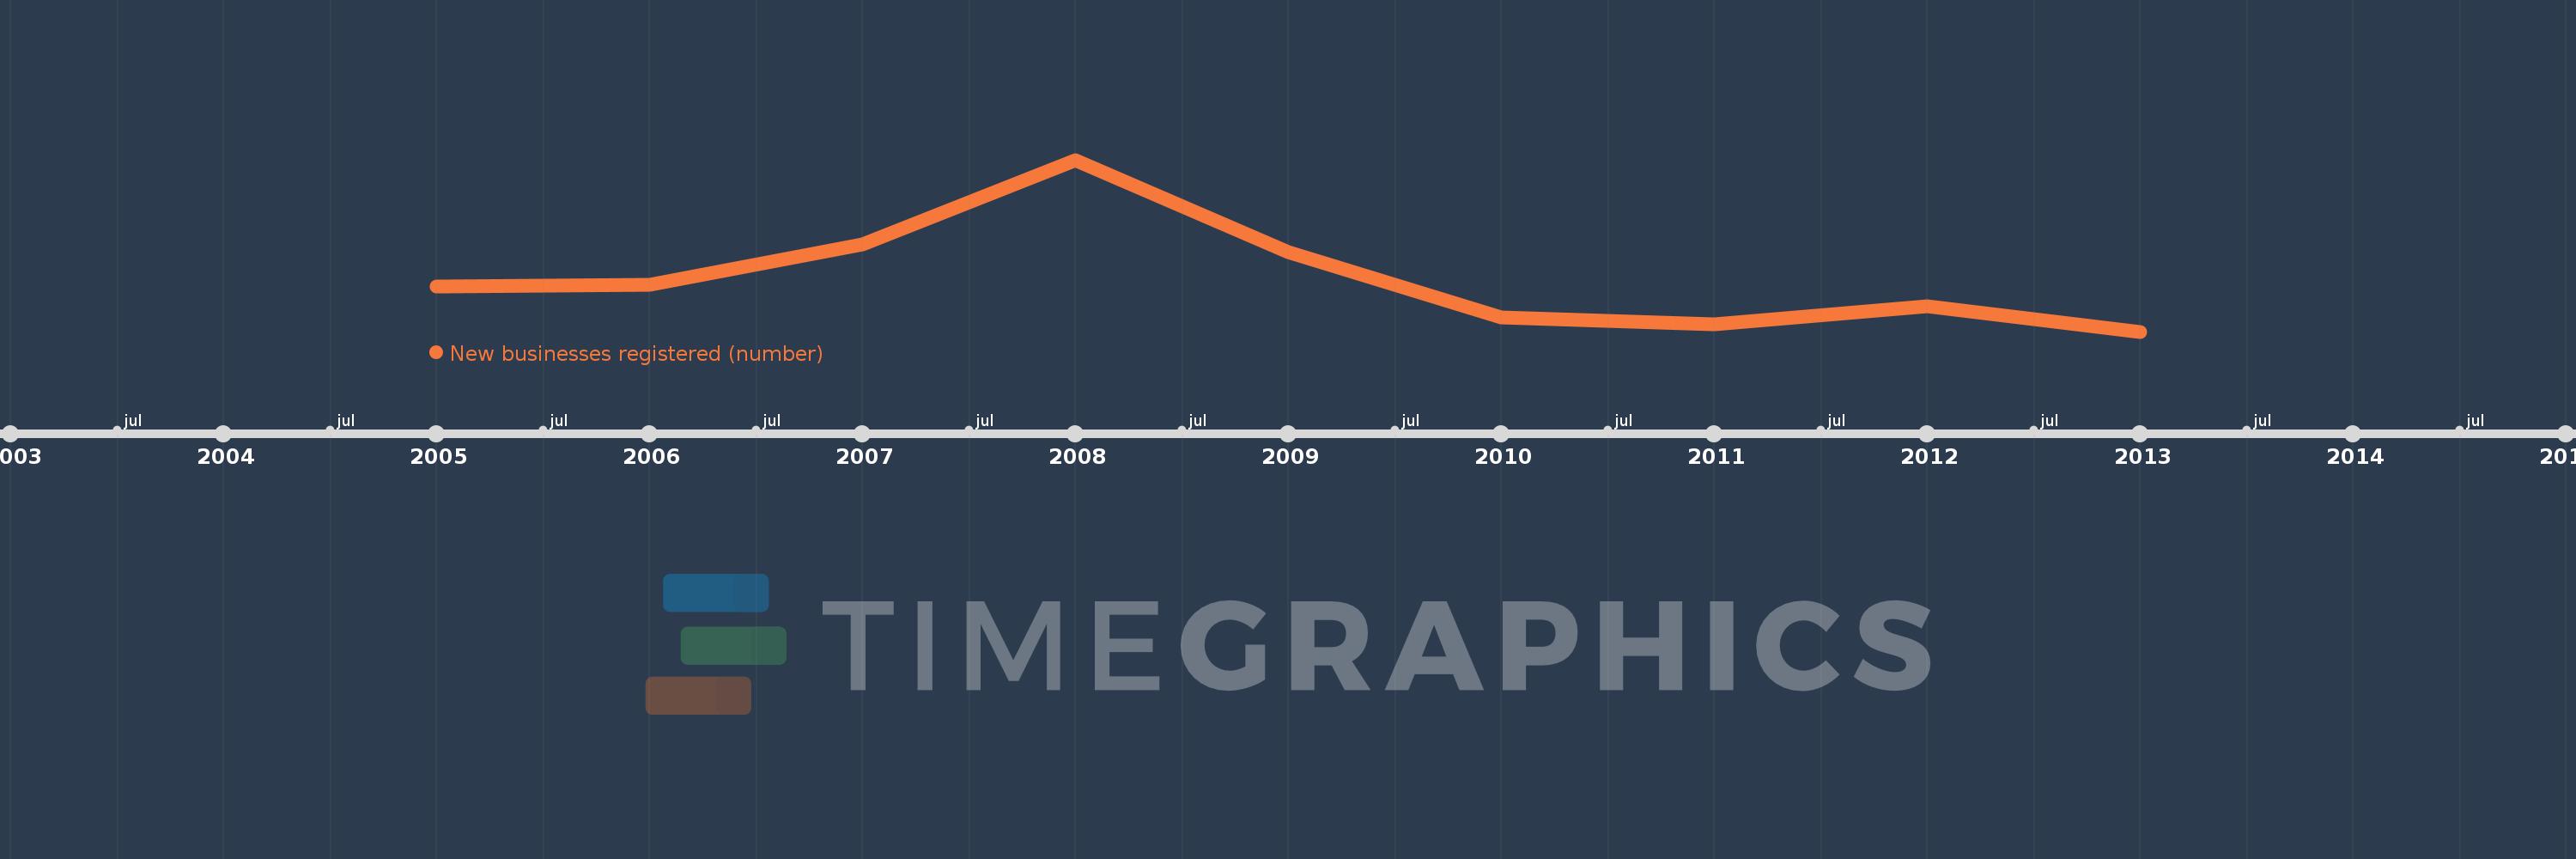
Questa scala temporale mostra un grafico dal 2005 anno al 2013 anno. St. Vincent and the Grenadines. I dati fino ad 2004 anno non disponibili. Il numero di osservazioni attuali secondo i date: 9.
La fonte (nome):
Indicatori dello sviluppo mondiale
La fonte (organizzazione):
World Bank's Entrepreneurship Survey and database (http://econ.worldbank.org/research/entrepreneurship).
Categorie:
Private Sector
sono stati aggiornati
23 apr 2017 anni
Indicatori delle variazioni dei valori per anni
In media:
130.333
Minima:
101.0
1 gen 2013 anni
Massimo:
196.0
1 gen 2008 anni
Alla data di osservazione
Valore
Variazione assoluta
La variazione rispetto al valore precedente
1 gen 2005 anni
126.0
+126.0
0.0%
1 gen 2006 anni
127.0
+1.0
0.79%
1 gen 2007 anni
149.0
+22.0
17.32%
1 gen 2008 anni
196.0
+47.0
31.54%
1 gen 2009 anni
145.0
-51.0
-26.02%
1 gen 2010 anni
109.0
-36.0
-24.83%
1 gen 2011 anni
105.0
-4.0
-3.67%
1 gen 2012 anni
115.0
+10.0
9.52%
1 gen 2013 anni
101.0
-14.0
-12.17%
Classificazione dei paesi secondo i statistiche attuali per anni