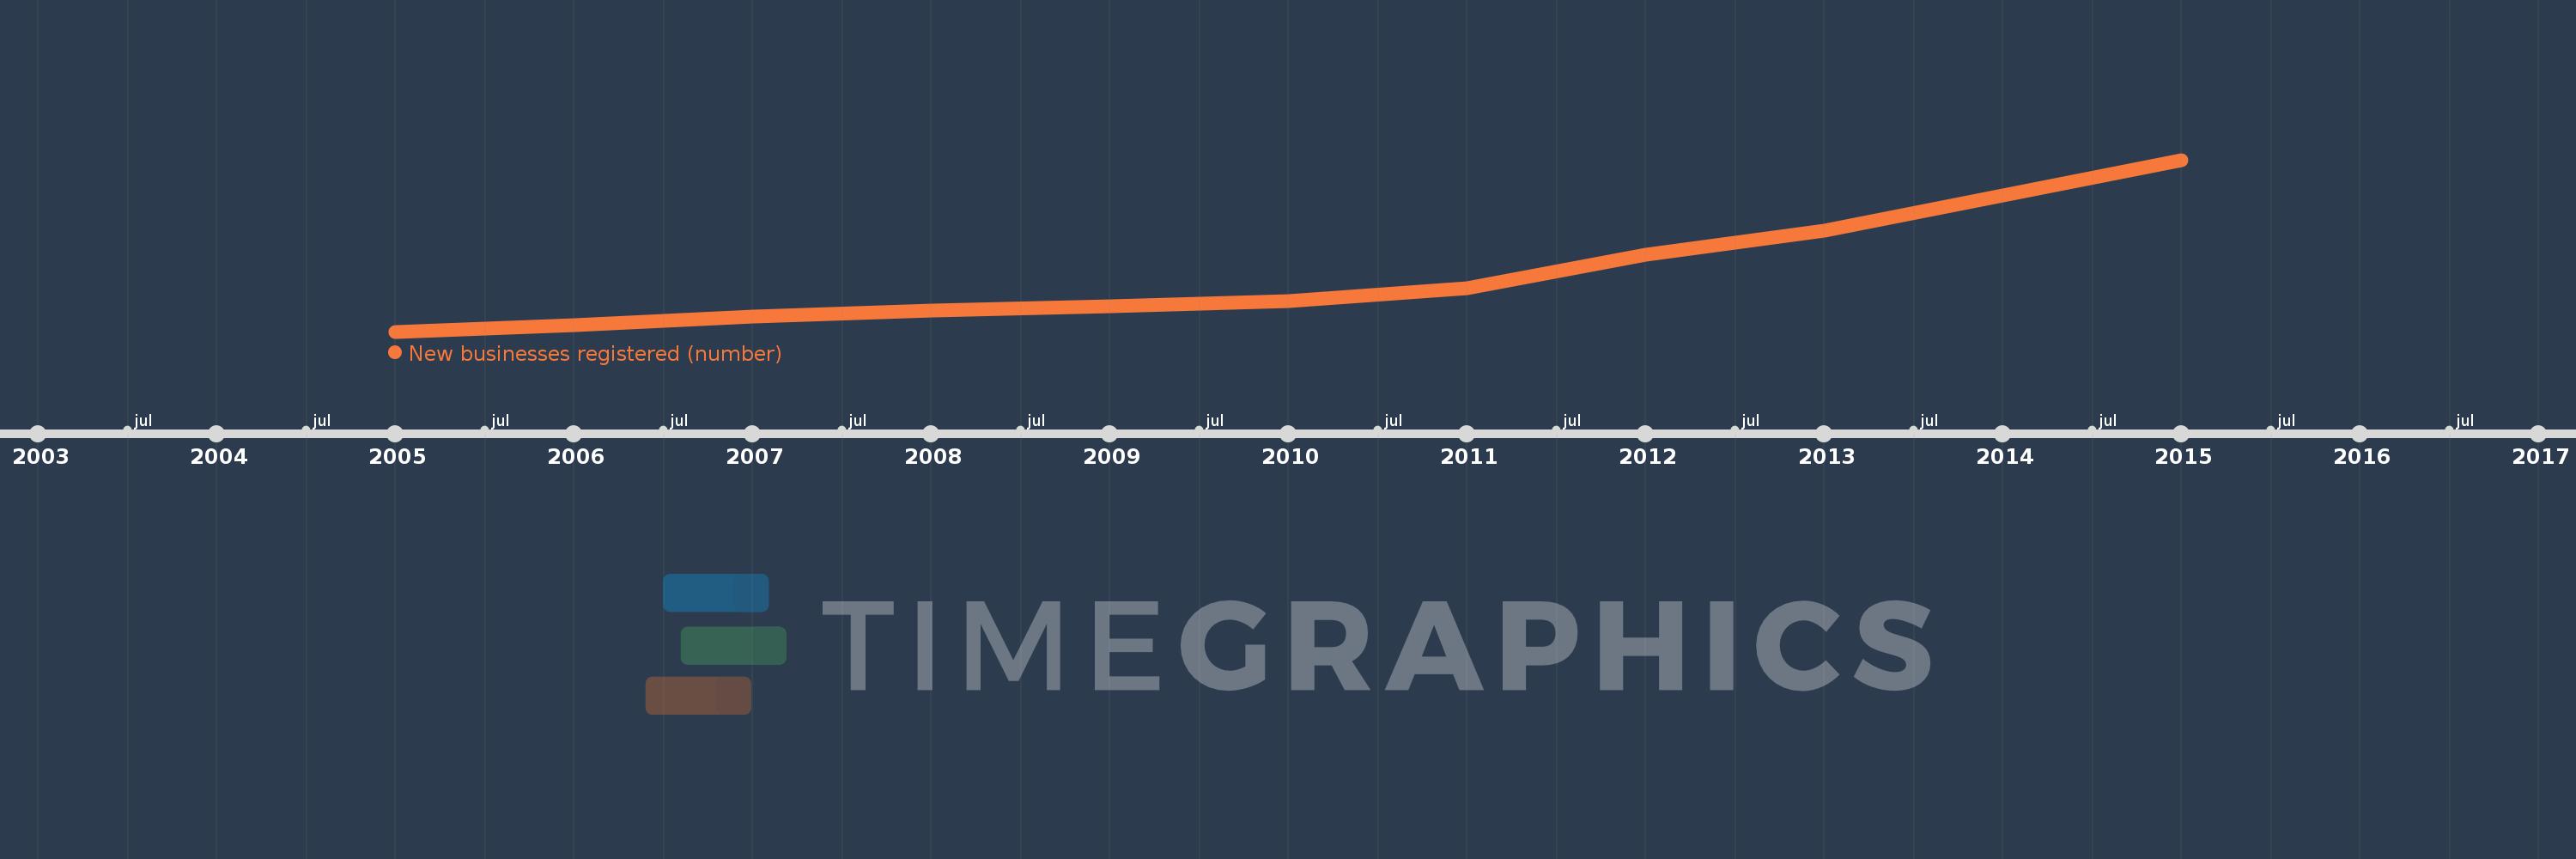
Questa scala temporale mostra un grafico dal 2005 anno al 2015 anno. Chile. I dati fino ad 2004 anno non disponibili. Il numero di osservazioni attuali secondo i date: 10.
La fonte (nome):
Indicatori dello sviluppo mondiale
La fonte (organizzazione):
World Bank's Entrepreneurship Survey and database (http://econ.worldbank.org/research/entrepreneurship).
Categorie:
Private Sector
sono stati aggiornati
23 apr 2017 anni
Indicatori delle variazioni dei valori per anni
In media:
46.671 Mille.
Minima:
25.928 Mille.
1 gen 2005 anni
Massimo:
98.406 Mille.
1 gen 2015 anni
Alla data di osservazione
Valore
Variazione assoluta
La variazione rispetto al valore precedente
1 gen 2005 anni
25.928 Mille.
+25.928 Mille.
0.0%
1 gen 2006 anni
28.684 Mille.
+2.756 Mille.
10.63%
1 gen 2007 anni
32.112 Mille.
+3.428 Mille.
11.95%
1 gen 2008 anni
34.815 Mille.
+2.703 Mille.
8.42%
1 gen 2009 anni
36.698 Mille.
+1.883 Mille.
5.41%
1 gen 2010 anni
38.87 Mille.
+2.172 Mille.
5.92%
1 gen 2011 anni
44.353 Mille.
+5.483 Mille.
14.11%
1 gen 2012 anni
58.407 Mille.
+14.054 Mille.
31.69%
1 gen 2013 anni
68.439 Mille.
+10.032 Mille.
17.18%
1 gen 2015 anni
98.406 Mille.
+29.967 Mille.
43.79%
Classificazione dei paesi secondo i statistiche attuali per anni