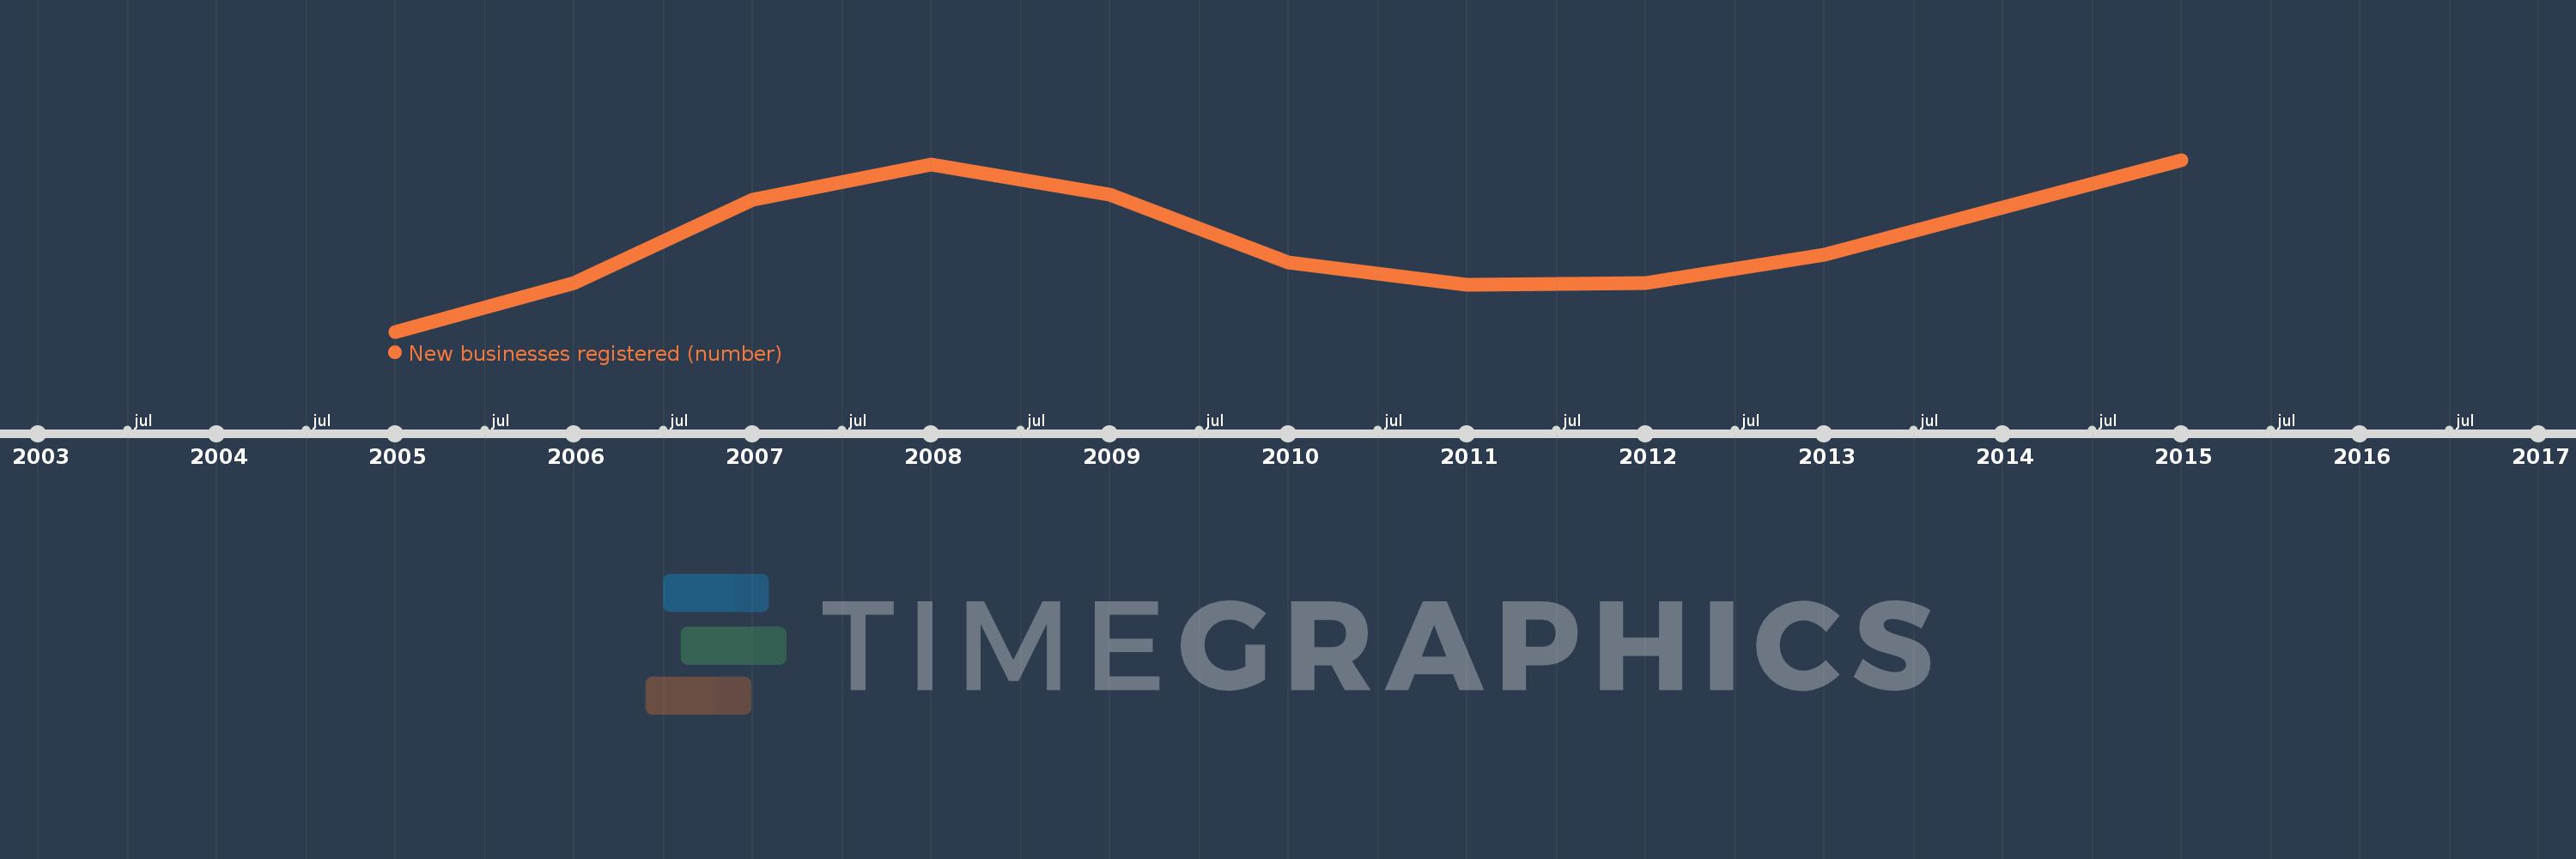
Questa scala temporale mostra un grafico dal 2005 anno al 2015 anno. Netherlands. I dati fino ad 2004 anno non disponibili. Il numero di osservazioni attuali secondo i date: 10.
La fonte (nome):
Indicatori dello sviluppo mondiale
La fonte (organizzazione):
World Bank's Entrepreneurship Survey and database (http://econ.worldbank.org/research/entrepreneurship).
Categorie:
Private Sector
sono stati aggiornati
23 apr 2017 anni
Indicatori delle variazioni dei valori per anni
In media:
50.693 Mille.
Minima:
41.696 Mille.
1 gen 2005 anni
Massimo:
58.9 Mille.
1 gen 2015 anni
Alla data di osservazione
Valore
Variazione assoluta
La variazione rispetto al valore precedente
1 gen 2005 anni
41.696 Mille.
+41.696 Mille.
0.0%
1 gen 2006 anni
46.514 Mille.
+4.818 Mille.
11.56%
1 gen 2007 anni
54.94 Mille.
+8.426 Mille.
18.11%
1 gen 2008 anni
58.427 Mille.
+3.487 Mille.
6.35%
1 gen 2009 anni
55.419 Mille.
-3.008 Mille.
-5.15%
1 gen 2010 anni
48.66 Mille.
-6.759 Mille.
-12.2%
1 gen 2011 anni
46.366 Mille.
-2.294 Mille.
-4.71%
1 gen 2012 anni
46.578 Mille.
+212.0
0.46%
1 gen 2013 anni
49.425 Mille.
+2.847 Mille.
6.11%
1 gen 2015 anni
58.9 Mille.
+9.475 Mille.
19.17%
Classificazione dei paesi secondo i statistiche attuali per anni