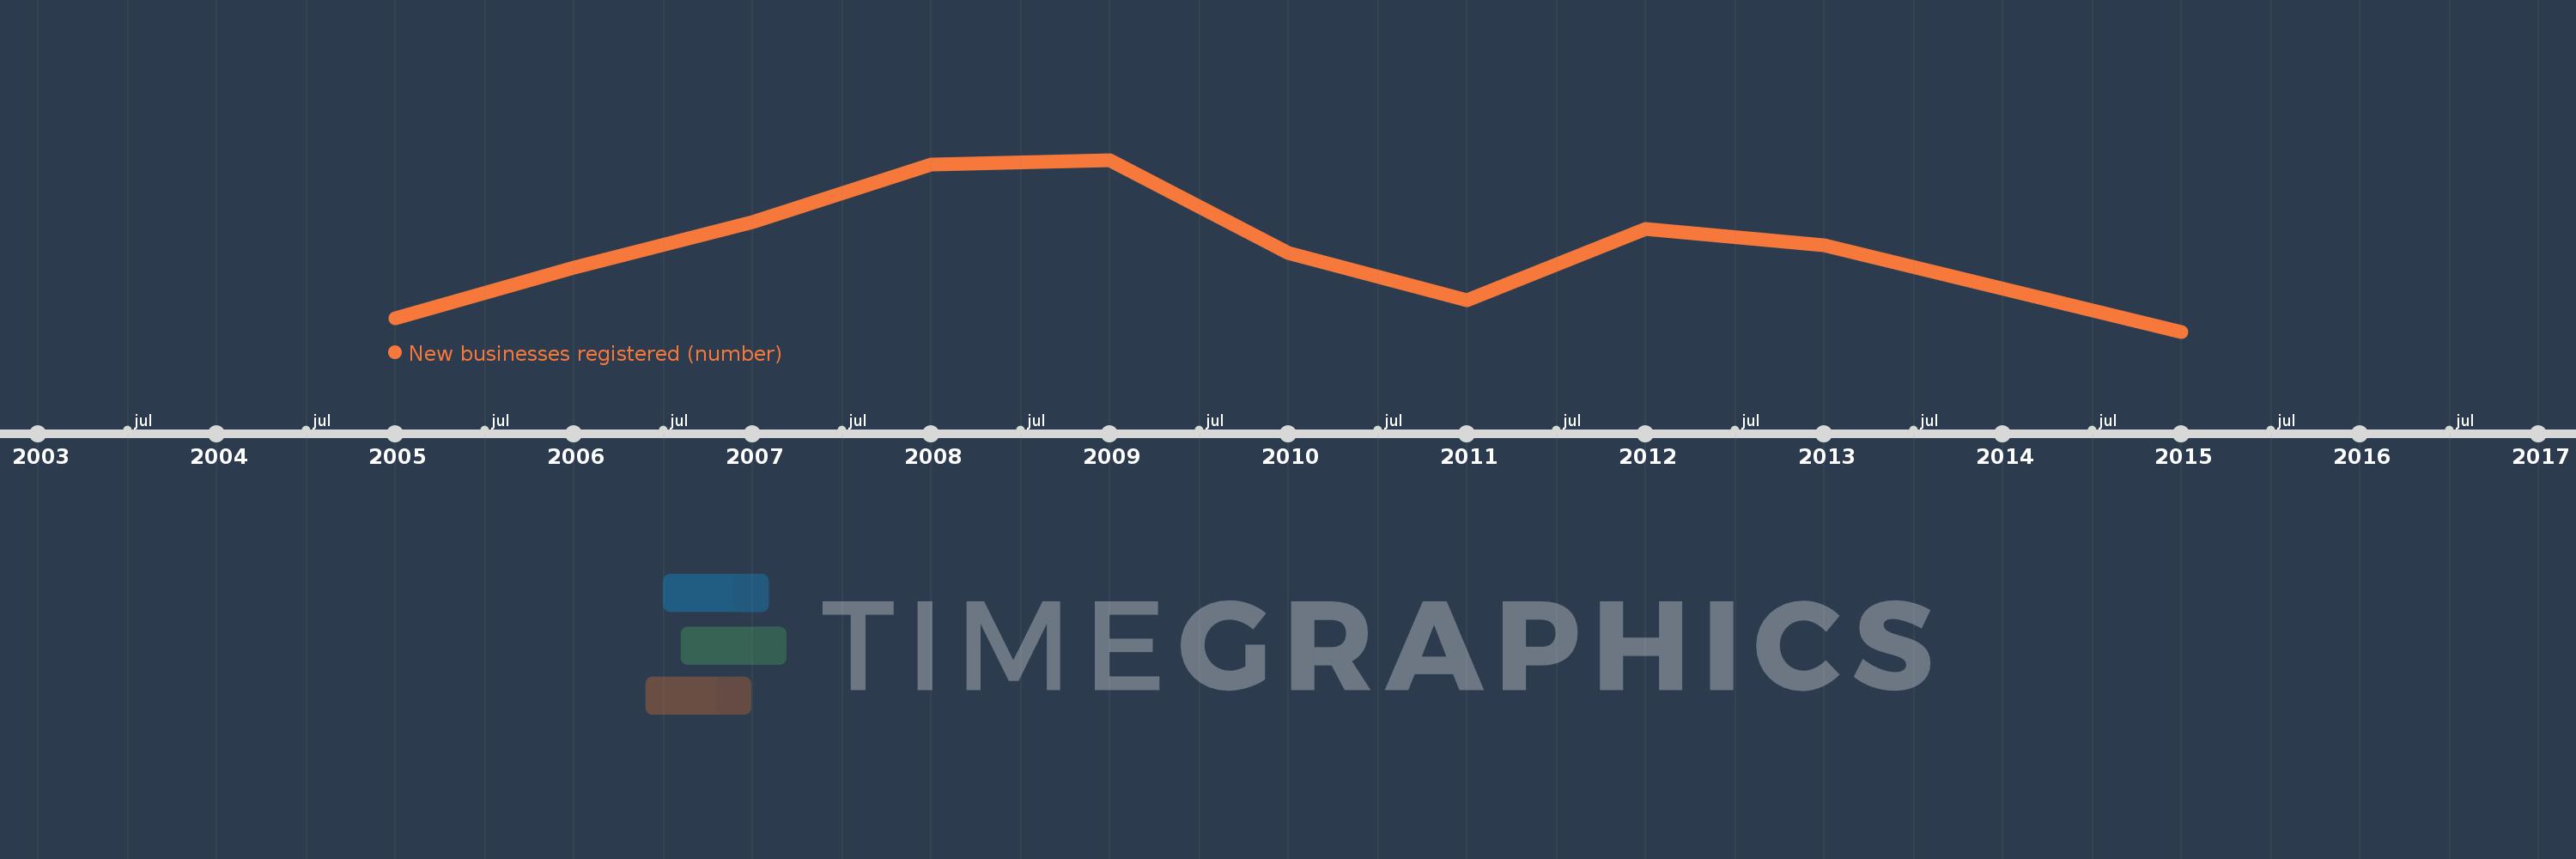
Questa scala temporale mostra un grafico dal 2005 anno al 2015 anno. Mauritius. I dati fino ad 2004 anno non disponibili. Il numero di osservazioni attuali secondo i date: 10.
La fonte (nome):
Indicatori dello sviluppo mondiale
La fonte (organizzazione):
World Bank's Entrepreneurship Survey and database (http://econ.worldbank.org/research/entrepreneurship).
Categorie:
Private Sector
sono stati aggiornati
23 apr 2017 anni
Indicatori delle variazioni dei valori per anni
In media:
6.734 Mille.
Minima:
4.633 Mille.
1 gen 2015 anni
Massimo:
9.012 Mille.
1 gen 2009 anni
Alla data di osservazione
Valore
Variazione assoluta
La variazione rispetto al valore precedente
1 gen 2005 anni
4.976 Mille.
+4.976 Mille.
0.0%
1 gen 2006 anni
6.26 Mille.
+1.284 Mille.
25.8%
1 gen 2007 anni
7.435 Mille.
+1.175 Mille.
18.77%
1 gen 2008 anni
8.888 Mille.
+1.453 Mille.
19.54%
1 gen 2009 anni
9.012 Mille.
+124.0
1.4%
1 gen 2010 anni
6.631 Mille.
-2.381 Mille.
-26.42%
1 gen 2011 anni
5.442 Mille.
-1.189 Mille.
-17.93%
1 gen 2012 anni
7.239 Mille.
+1.797 Mille.
33.02%
1 gen 2013 anni
6.825 Mille.
-414.0
-5.72%
1 gen 2015 anni
4.633 Mille.
-2.192 Mille.
-32.12%
Classificazione dei paesi secondo i statistiche attuali per anni