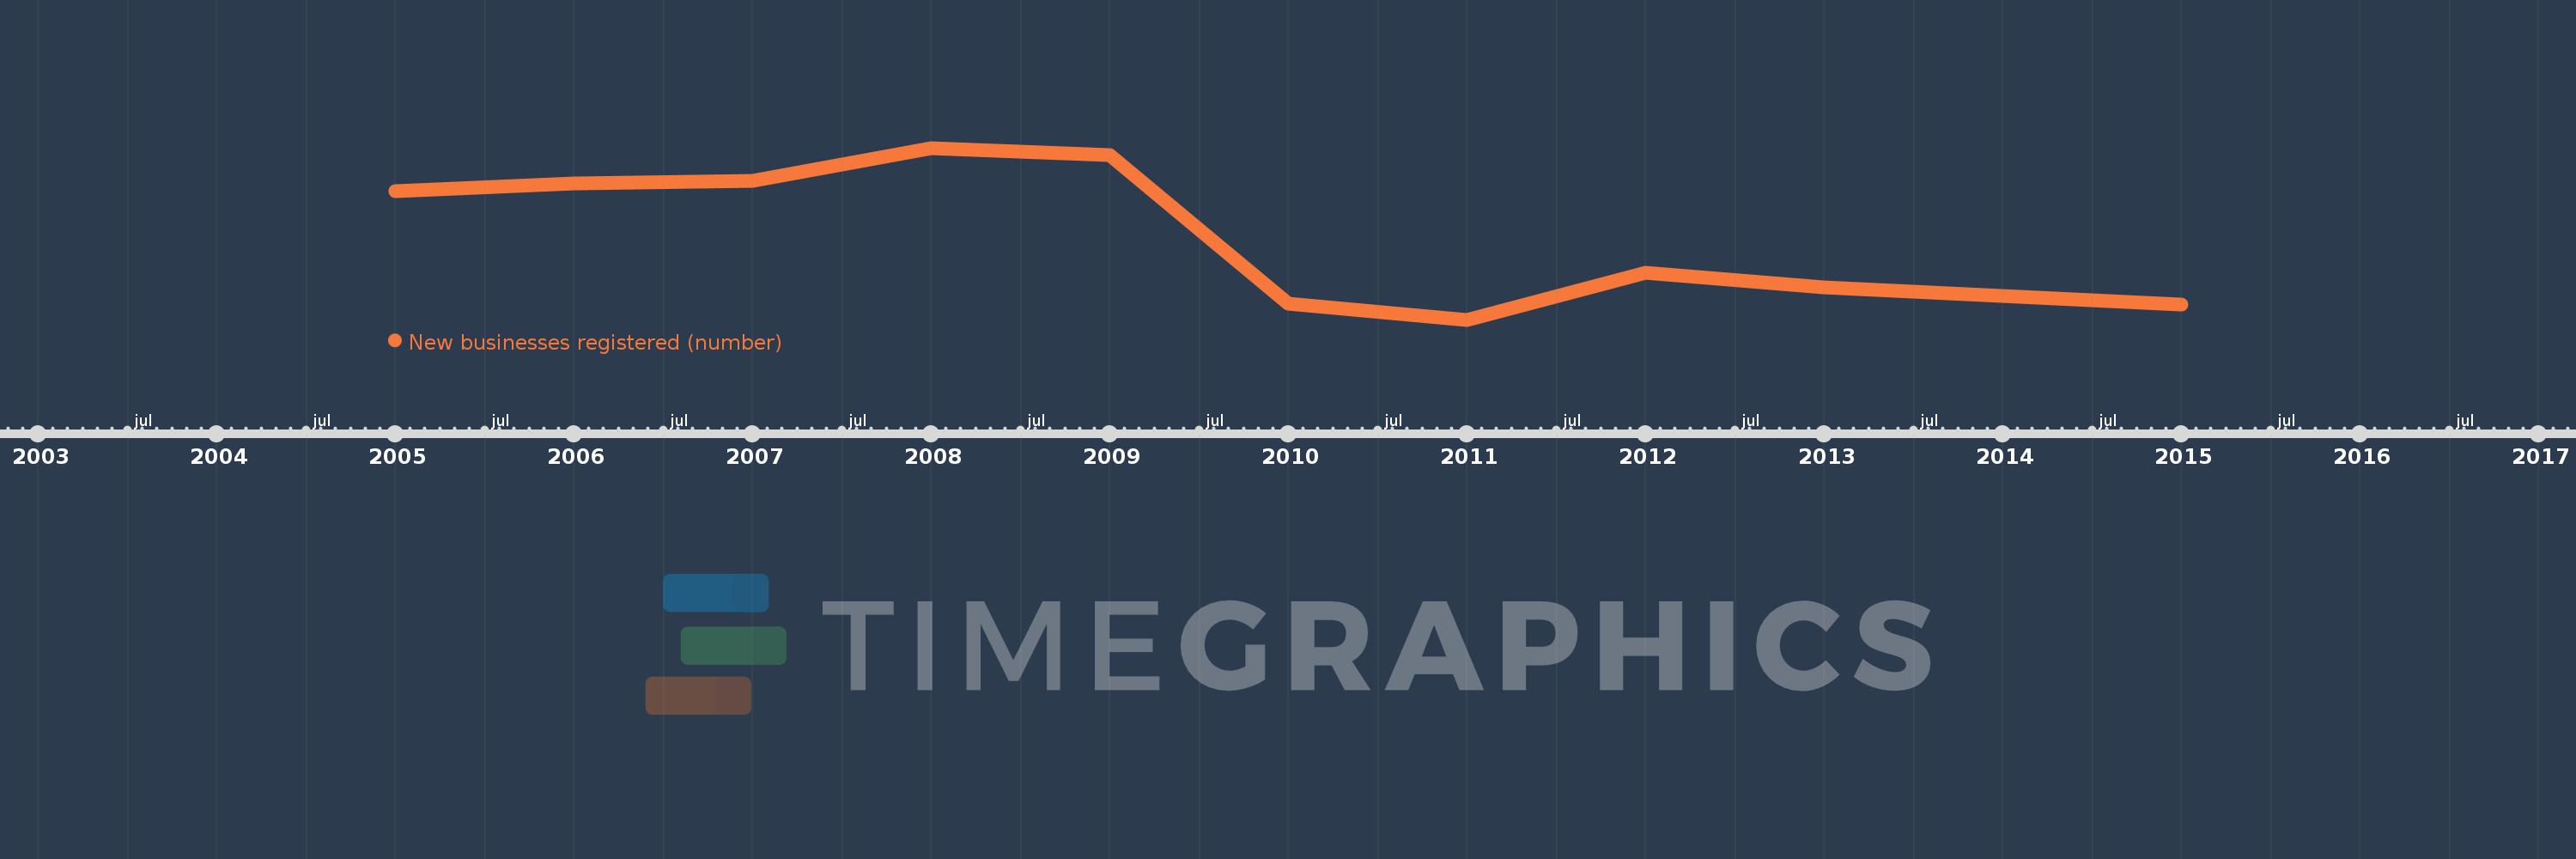
Questa scala temporale mostra un grafico dal 2005 anno al 2015 anno. Romania. I dati fino ad 2004 anno non disponibili. Il numero di osservazioni attuali secondo i date: 10.
La fonte (nome):
Indicatori dello sviluppo mondiale
La fonte (organizzazione):
World Bank's Entrepreneurship Survey and database (http://econ.worldbank.org/research/entrepreneurship).
Categorie:
Private Sector
sono stati aggiornati
23 apr 2017 anni
Indicatori delle variazioni dei valori per anni
In media:
77.093 Mille.
Minima:
51.859 Mille.
1 gen 2011 anni
Massimo:
102.745 Mille.
1 gen 2008 anni
Alla data di osservazione
Valore
Variazione assoluta
La variazione rispetto al valore precedente
1 gen 2005 anni
89.909 Mille.
+89.909 Mille.
0.0%
1 gen 2006 anni
92.334 Mille.
+2.425 Mille.
2.7%
1 gen 2007 anni
92.979 Mille.
+645.0
0.7%
1 gen 2008 anni
102.745 Mille.
+9.766 Mille.
10.5%
1 gen 2009 anni
100.646 Mille.
-2.099 Mille.
-2.04%
1 gen 2010 anni
56.69 Mille.
-43.956 Mille.
-43.67%
1 gen 2011 anni
51.859 Mille.
-4.831 Mille.
-8.52%
1 gen 2012 anni
65.842 Mille.
+13.983 Mille.
26.96%
1 gen 2013 anni
61.542 Mille.
-4.3 Mille.
-6.53%
1 gen 2015 anni
56.381 Mille.
-5.161 Mille.
-8.39%
Classificazione dei paesi secondo i statistiche attuali per anni