Download Queste statistiche in altri paesi:
Linea del tempo:
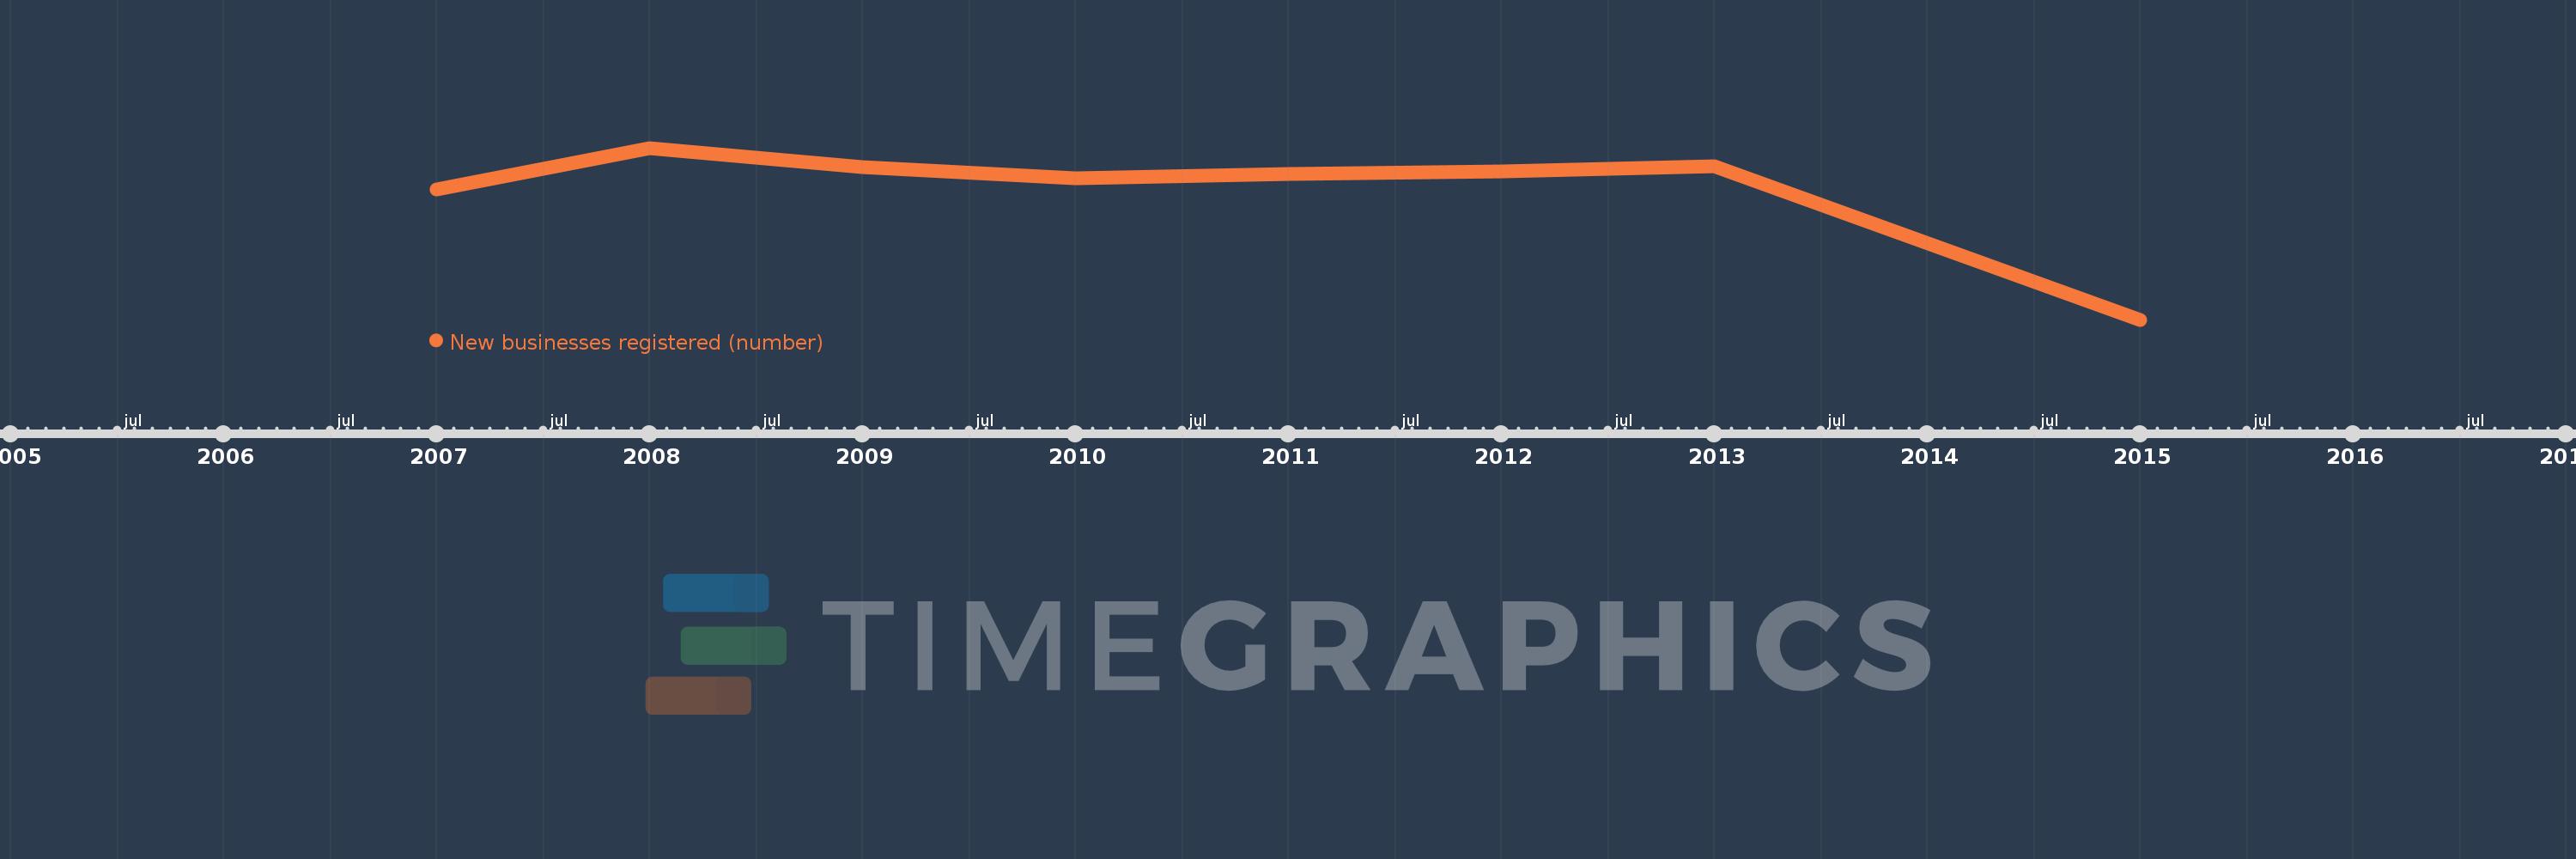
Questa scala temporale mostra un grafico dal 2007 anno al 2015 anno. Japan. I dati fino ad 2006 anno non disponibili. Il numero di osservazioni attuali secondo i date: 8.
La fonte (nome):
Indicatori dello sviluppo mondiale
La fonte (organizzazione):
World Bank's Entrepreneurship Survey and database (http://econ.worldbank.org/research/entrepreneurship).
Categorie:
Private Sector
sono stati aggiornati
23 apr 2017 anni
Indicatori delle variazioni dei valori per anni
Minima:
11.886 Mille.
1 gen 2015 anni
Massimo:
101.439 Mille.
1 gen 2008 anni
Alla data di osservazione
Valore
Variazione assoluta
La variazione rispetto al valore precedente
1 gen 2007 anni
79.962 Mille.
+79.962 Mille.
0.0%
1 gen 2008 anni
101.439 Mille.
+21.477 Mille.
26.86%
1 gen 2009 anni
91.635 Mille.
-9.804 Mille.
-9.66%
1 gen 2010 anni
85.673 Mille.
-5.962 Mille.
-6.51%
1 gen 2011 anni
87.688 Mille.
+2.015 Mille.
2.35%
1 gen 2012 anni
89.373 Mille.
+1.685 Mille.
1.92%
1 gen 2013 anni
91.751 Mille.
+2.378 Mille.
2.66%
1 gen 2015 anni
11.886 Mille.
-79.865 Mille.
-87.05%
Classificazione dei paesi secondo i statistiche attuali per anni