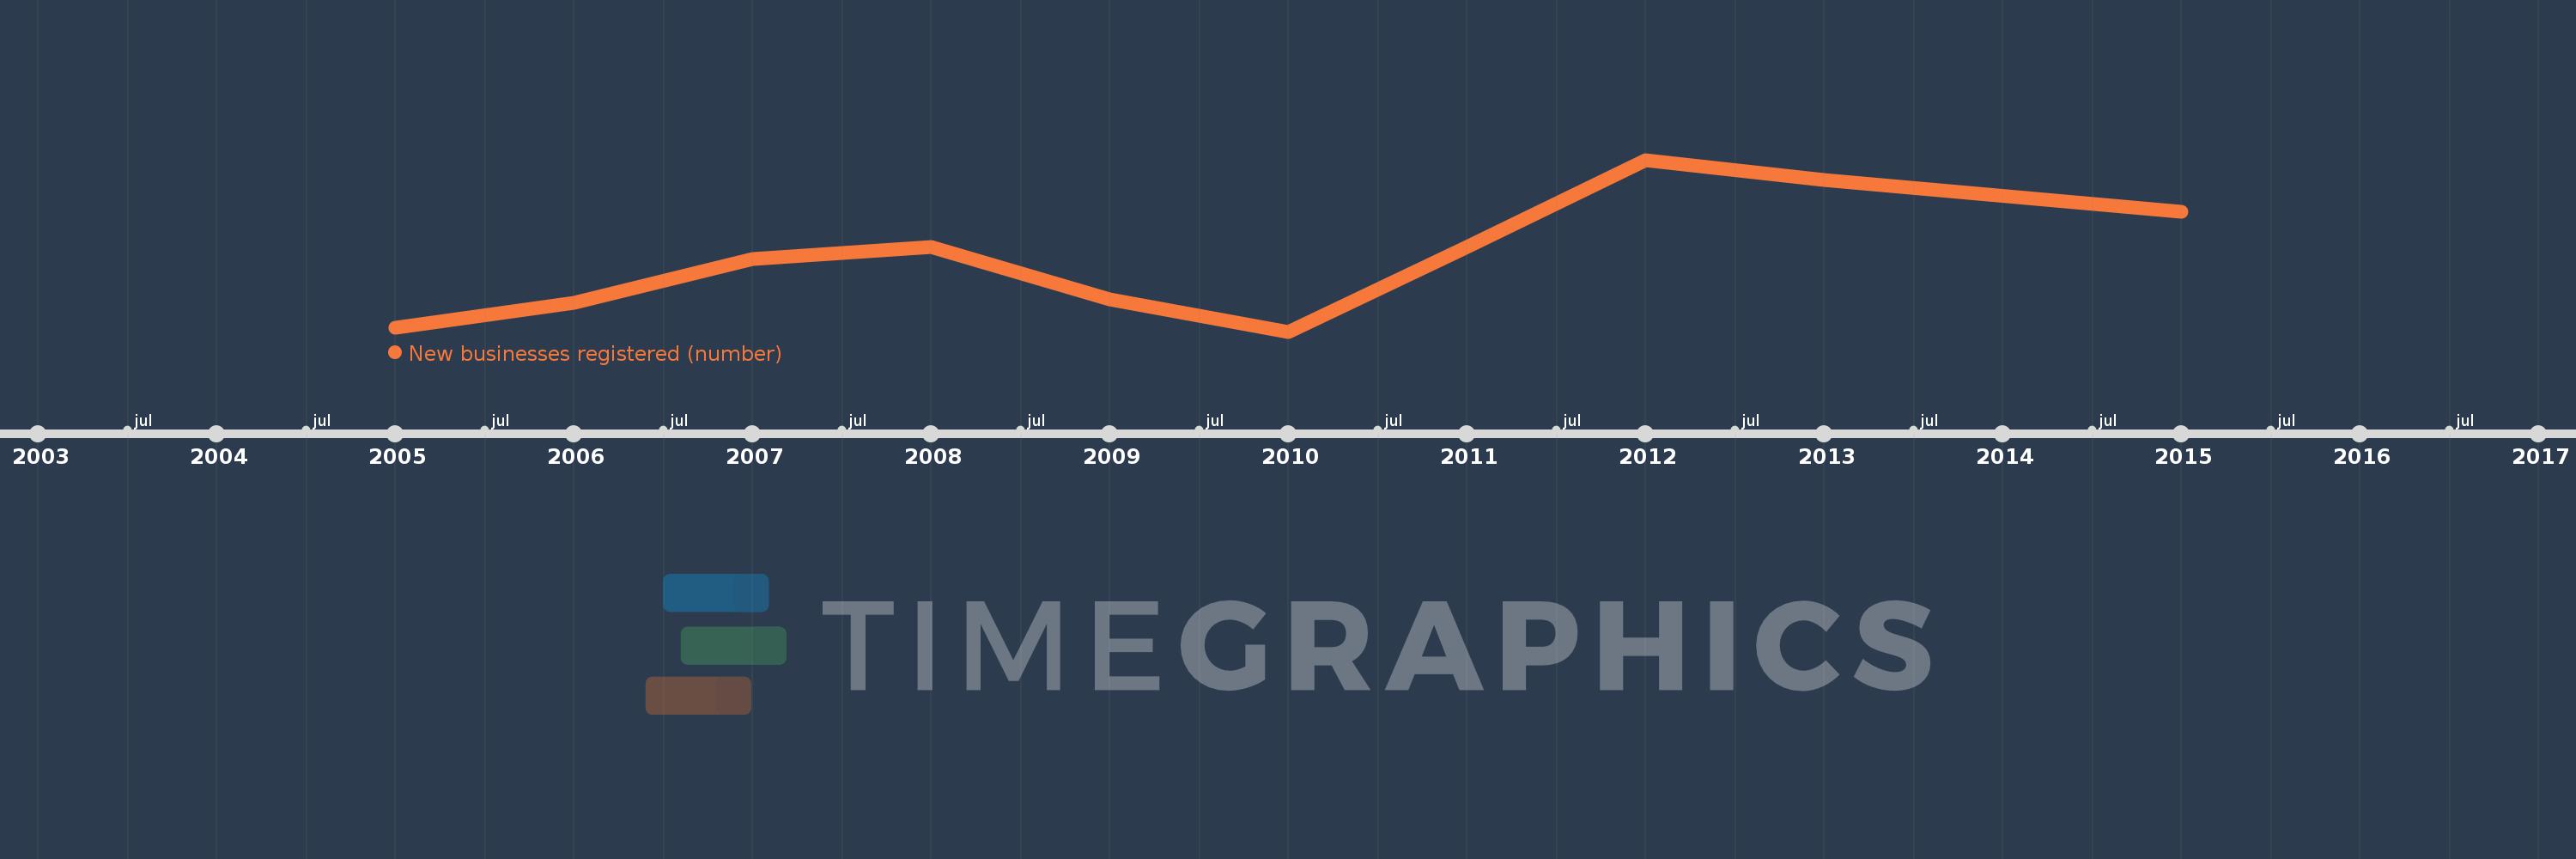
Questa scala temporale mostra un grafico dal 2005 anno al 2015 anno. Latvia. I dati fino ad 2004 anno non disponibili. Il numero di osservazioni attuali secondo i date: 10.
La fonte (nome):
Indicatori dello sviluppo mondiale
La fonte (organizzazione):
World Bank's Entrepreneurship Survey and database (http://econ.worldbank.org/research/entrepreneurship).
Categorie:
Private Sector
sono stati aggiornati
23 apr 2017 anni
Indicatori delle variazioni dei valori per anni
In media:
11.446 Mille.
Minima:
7.218 Mille.
1 gen 2010 anni
Massimo:
16.908 Mille.
1 gen 2012 anni
Alla data di osservazione
Valore
Variazione assoluta
La variazione rispetto al valore precedente
1 gen 2005 anni
7.412 Mille.
+7.412 Mille.
0.0%
1 gen 2006 anni
8.838 Mille.
+1.426 Mille.
19.24%
1 gen 2007 anni
11.306 Mille.
+2.468 Mille.
27.92%
1 gen 2008 anni
12.01 Mille.
+704.0
6.23%
1 gen 2009 anni
9.03 Mille.
-2.98 Mille.
-24.81%
1 gen 2010 anni
7.218 Mille.
-1.812 Mille.
-20.07%
1 gen 2011 anni
11.99 Mille.
+4.772 Mille.
66.11%
1 gen 2012 anni
16.908 Mille.
+4.918 Mille.
41.02%
1 gen 2013 anni
15.76 Mille.
-1.148 Mille.
-6.79%
1 gen 2015 anni
13.991 Mille.
-1.769 Mille.
-11.22%
Classificazione dei paesi secondo i statistiche attuali per anni