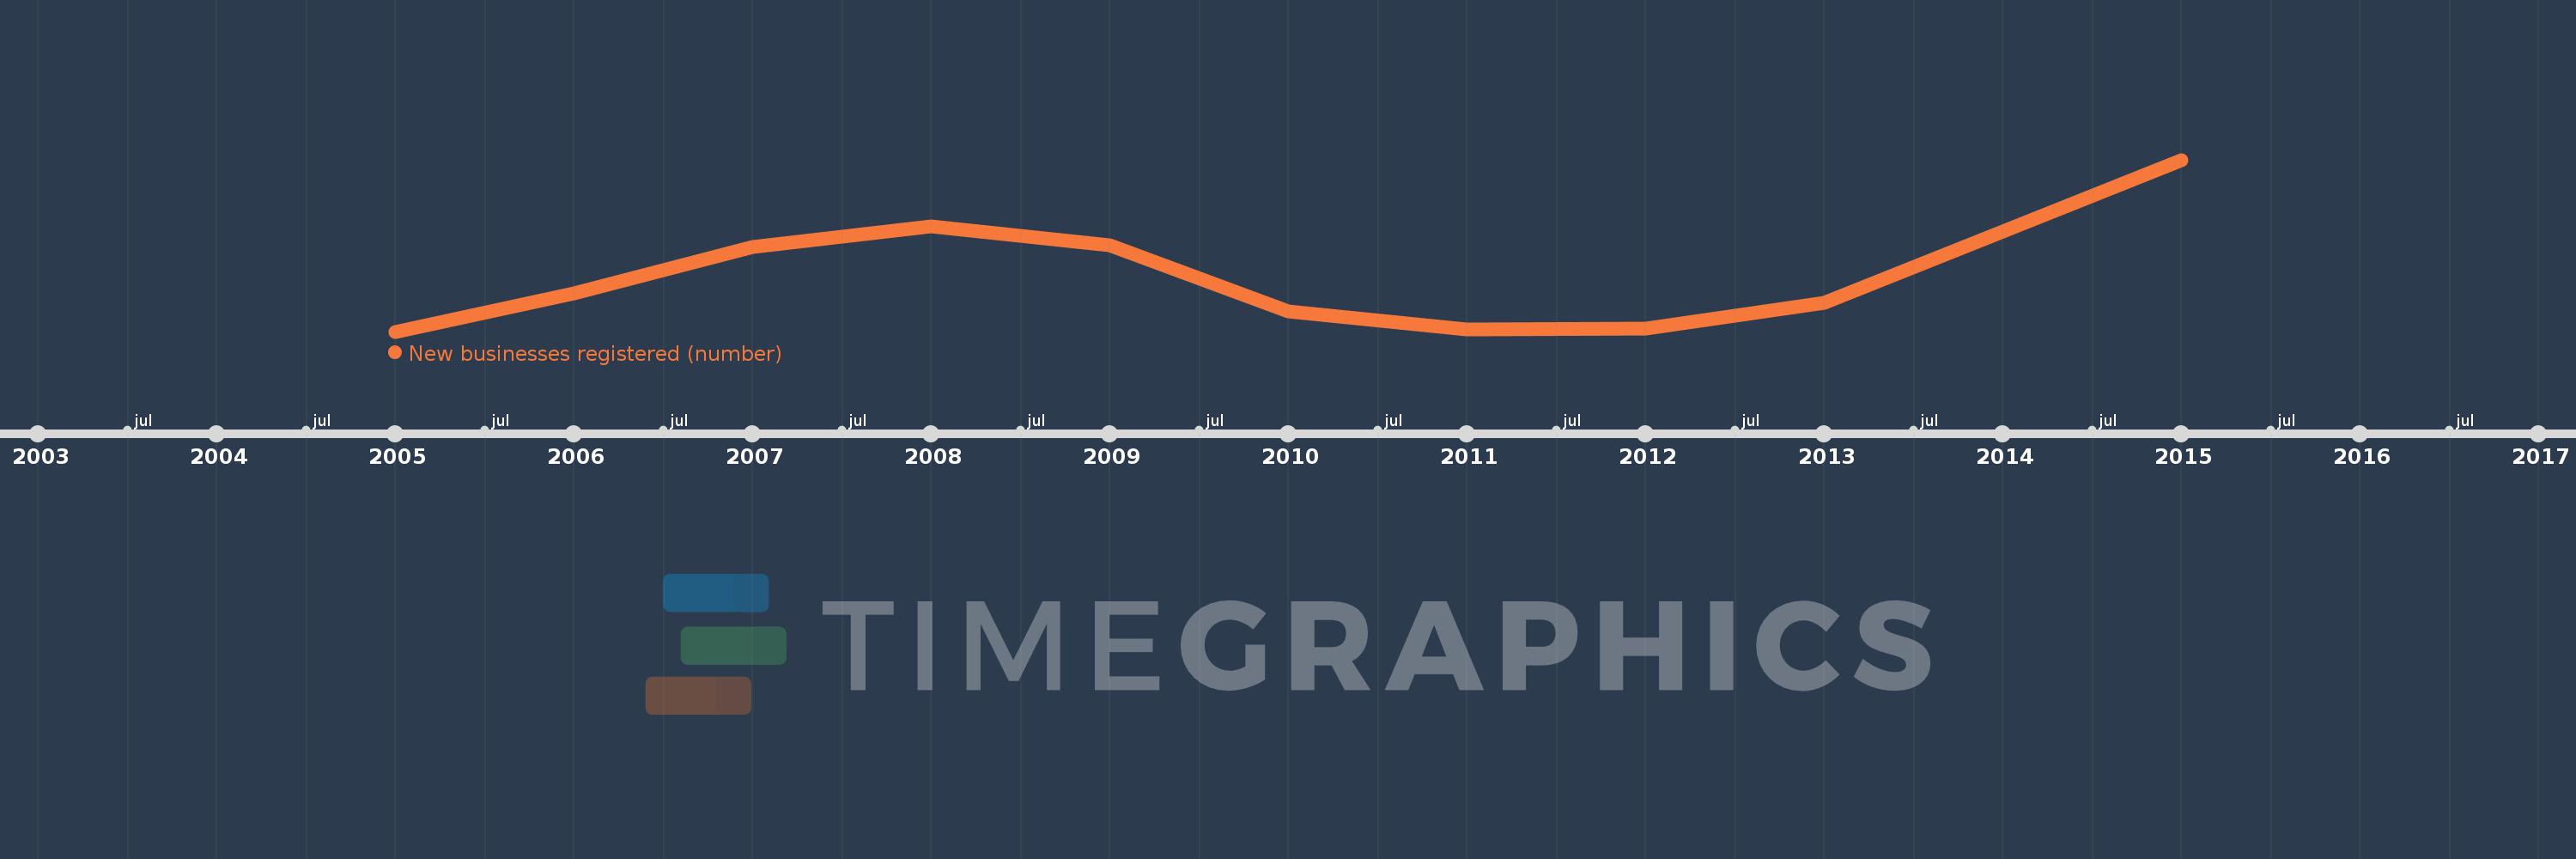
Questa scala temporale mostra un grafico dal 2005 anno al 2015 anno. Croatia. I dati fino ad 2004 anno non disponibili. Il numero di osservazioni attuali secondo i date: 10.
La fonte (nome):
Indicatori dello sviluppo mondiale
La fonte (organizzazione):
World Bank's Entrepreneurship Survey and database (http://econ.worldbank.org/research/entrepreneurship).
Categorie:
Private Sector
sono stati aggiornati
23 apr 2017 anni
Indicatori delle variazioni dei valori per anni
In media:
8.939 Mille.
Minima:
7.046 Mille.
1 gen 2005 anni
Massimo:
13.073 Mille.
1 gen 2015 anni
Alla data di osservazione
Valore
Variazione assoluta
La variazione rispetto al valore precedente
1 gen 2005 anni
7.046 Mille.
+7.046 Mille.
0.0%
1 gen 2006 anni
8.386 Mille.
+1.34 Mille.
19.02%
1 gen 2007 anni
10.01 Mille.
+1.624 Mille.
19.37%
1 gen 2008 anni
10.728 Mille.
+718.0
7.17%
1 gen 2009 anni
10.068 Mille.
-660.0
-6.15%
1 gen 2010 anni
7.74 Mille.
-2.328 Mille.
-23.12%
1 gen 2011 anni
7.128 Mille.
-612.0
-7.91%
1 gen 2012 anni
7.145 Mille.
+17.0
0.24%
1 gen 2013 anni
8.068 Mille.
+923.0
12.92%
1 gen 2015 anni
13.073 Mille.
+5.005 Mille.
62.04%
Classificazione dei paesi secondo i statistiche attuali per anni