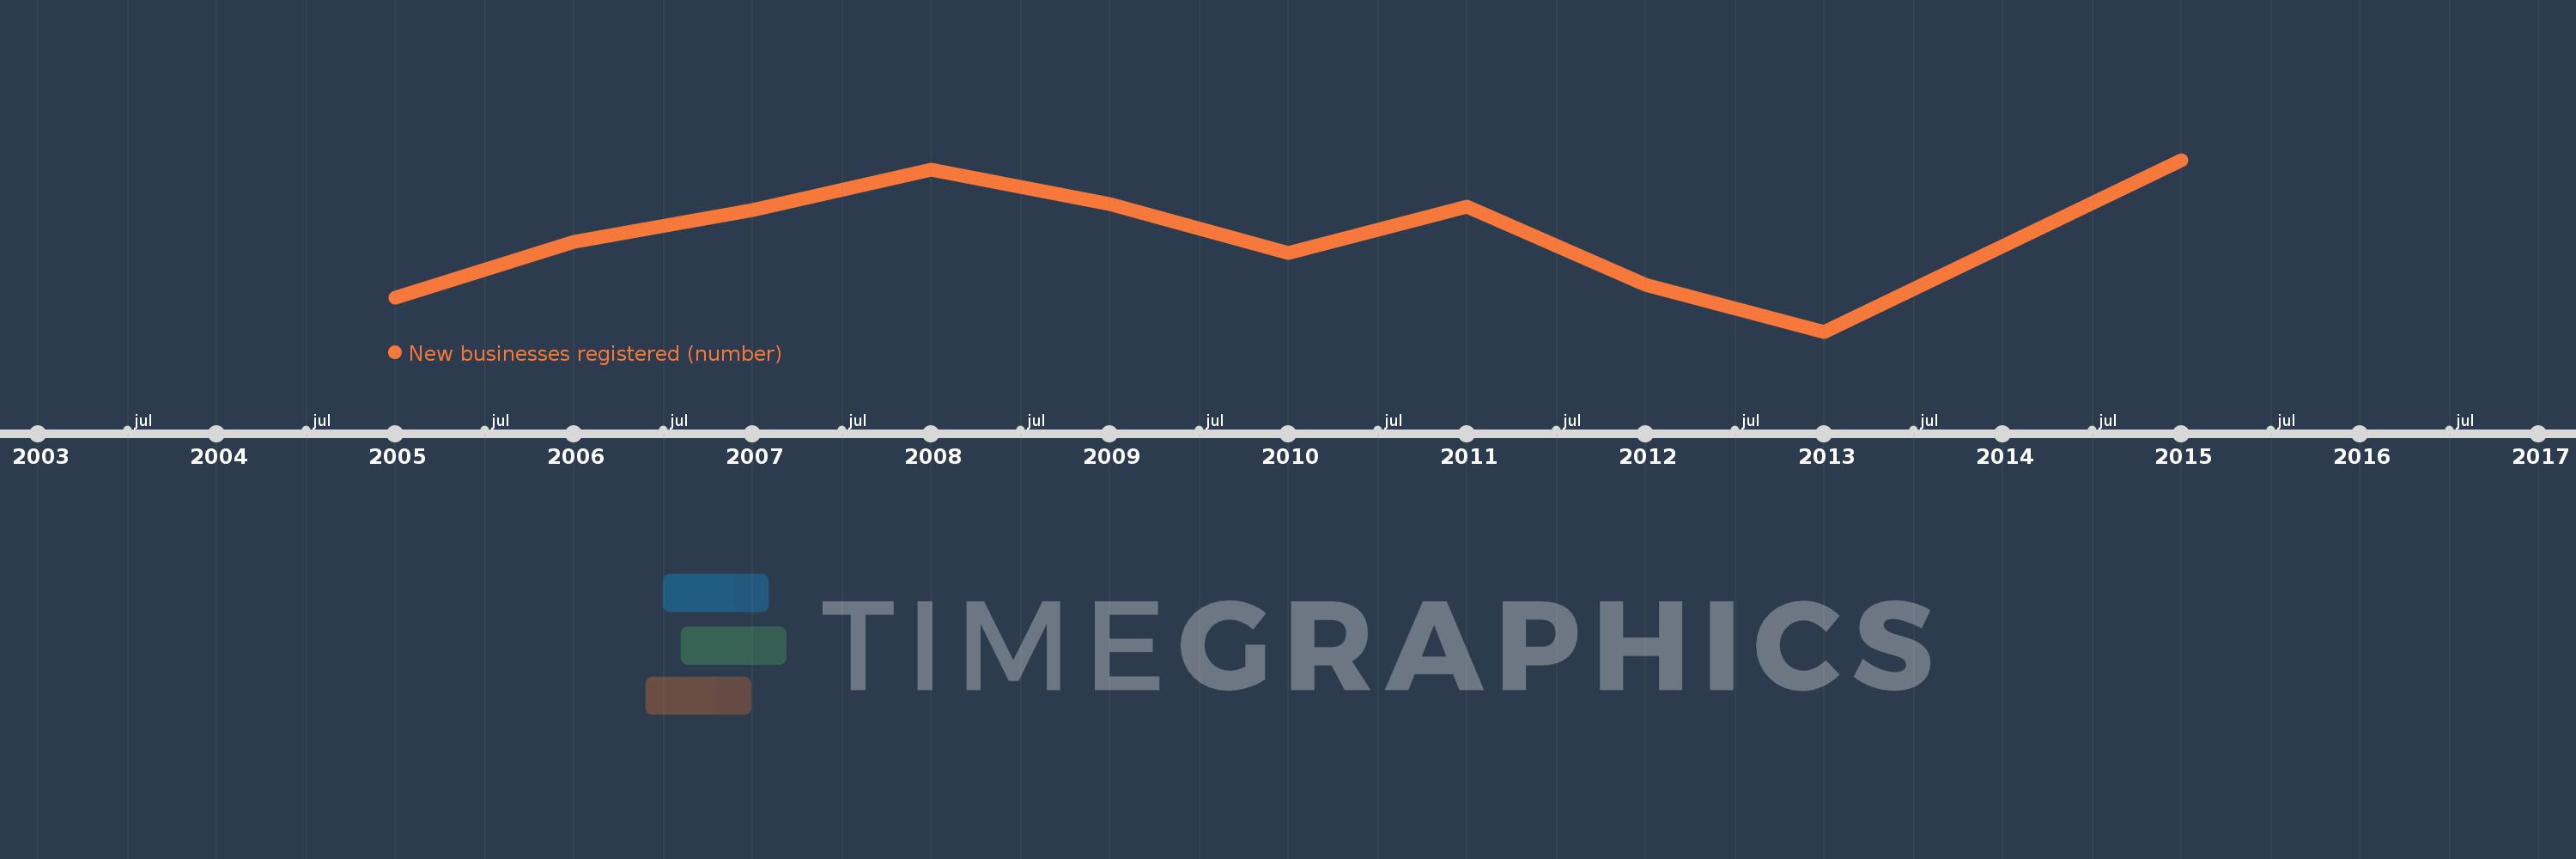
Questa scala temporale mostra un grafico dal 2005 anno al 2015 anno. Italy. I dati fino ad 2004 anno non disponibili. Il numero di osservazioni attuali secondo i date: 10.
La fonte (nome):
Indicatori dello sviluppo mondiale
La fonte (organizzazione):
World Bank's Entrepreneurship Survey and database (http://econ.worldbank.org/research/entrepreneurship).
Categorie:
Private Sector
sono stati aggiornati
23 apr 2017 anni
Indicatori delle variazioni dei valori per anni
In media:
84.67 Mille.
Minima:
75.645 Mille.
1 gen 2013 anni
Massimo:
91.853 Mille.
1 gen 2015 anni
Alla data di osservazione
Valore
Variazione assoluta
La variazione rispetto al valore precedente
1 gen 2005 anni
78.867 Mille.
+78.867 Mille.
0.0%
1 gen 2006 anni
84.125 Mille.
+5.258 Mille.
6.67%
1 gen 2007 anni
87.113 Mille.
+2.988 Mille.
3.55%
1 gen 2008 anni
90.95 Mille.
+3.837 Mille.
4.4%
1 gen 2009 anni
87.665 Mille.
-3.285 Mille.
-3.61%
1 gen 2010 anni
83.042 Mille.
-4.623 Mille.
-5.27%
1 gen 2011 anni
87.415 Mille.
+4.373 Mille.
5.27%
1 gen 2012 anni
80.028 Mille.
-7.387 Mille.
-8.45%
1 gen 2013 anni
75.645 Mille.
-4.383 Mille.
-5.48%
1 gen 2015 anni
91.853 Mille.
+16.208 Mille.
21.43%
Classificazione dei paesi secondo i statistiche attuali per anni