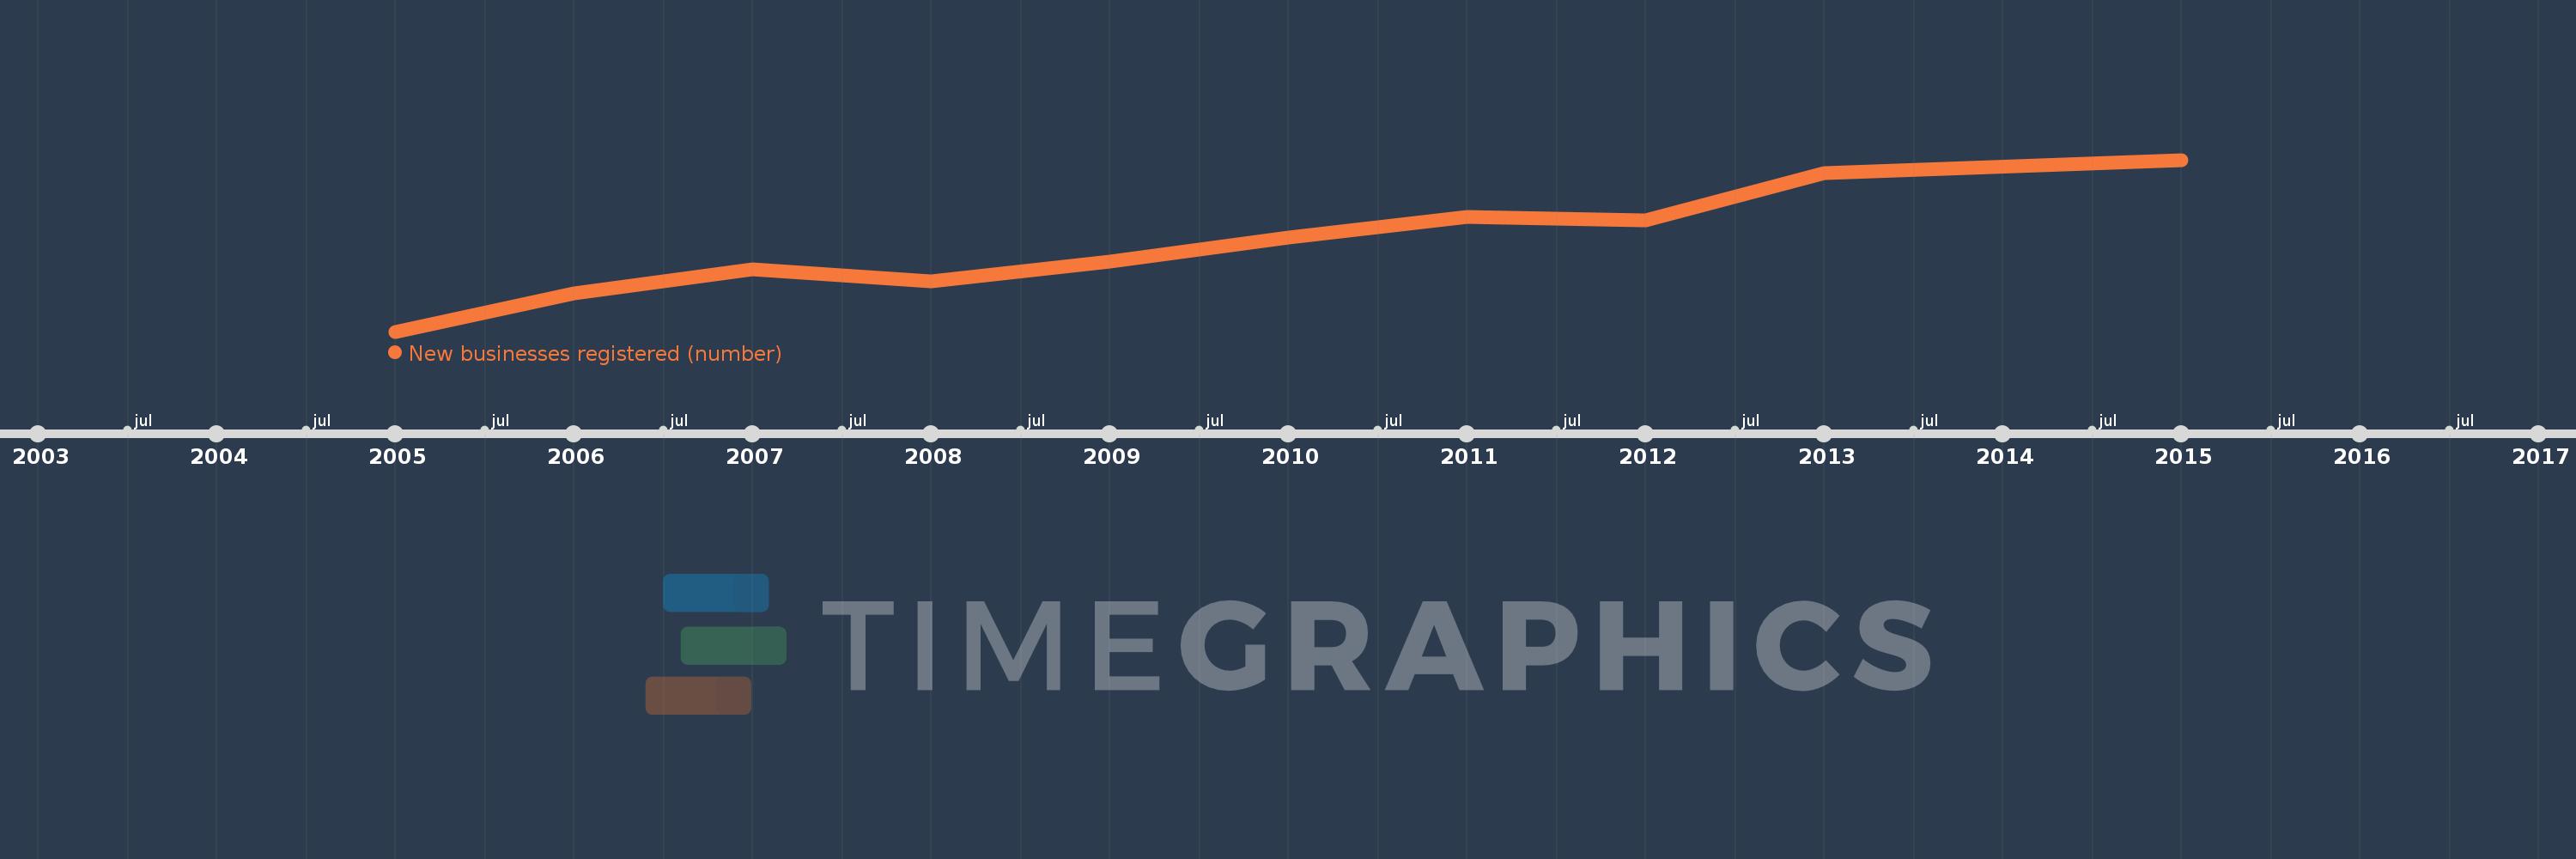
Questa scala temporale mostra un grafico dal 2005 anno al 2015 anno. Jordan. I dati fino ad 2004 anno non disponibili. Il numero di osservazioni attuali secondo i date: 10.
La fonte (nome):
Indicatori dello sviluppo mondiale
La fonte (organizzazione):
World Bank's Entrepreneurship Survey and database (http://econ.worldbank.org/research/entrepreneurship).
Categorie:
Private Sector
sono stati aggiornati
23 apr 2017 anni
Indicatori delle variazioni dei valori per anni
In media:
2.621 Mille.
Minima:
1.104 Mille.
1 gen 2005 anni
Massimo:
4.093 Mille.
1 gen 2015 anni
Alla data di osservazione
Valore
Variazione assoluta
La variazione rispetto al valore precedente
1 gen 2005 anni
1.104 Mille.
+1.104 Mille.
0.0%
1 gen 2006 anni
1.775 Mille.
+671.0
60.78%
1 gen 2007 anni
2.189 Mille.
+414.0
23.32%
1 gen 2008 anni
1.982 Mille.
-207.0
-9.46%
1 gen 2009 anni
2.315 Mille.
+333.0
16.8%
1 gen 2010 anni
2.735 Mille.
+420.0
18.14%
1 gen 2011 anni
3.106 Mille.
+371.0
13.56%
1 gen 2012 anni
3.039 Mille.
-67.0
-2.16%
1 gen 2013 anni
3.868 Mille.
+829.0
27.28%
1 gen 2015 anni
4.093 Mille.
+225.0
5.82%
Classificazione dei paesi secondo i statistiche attuali per anni