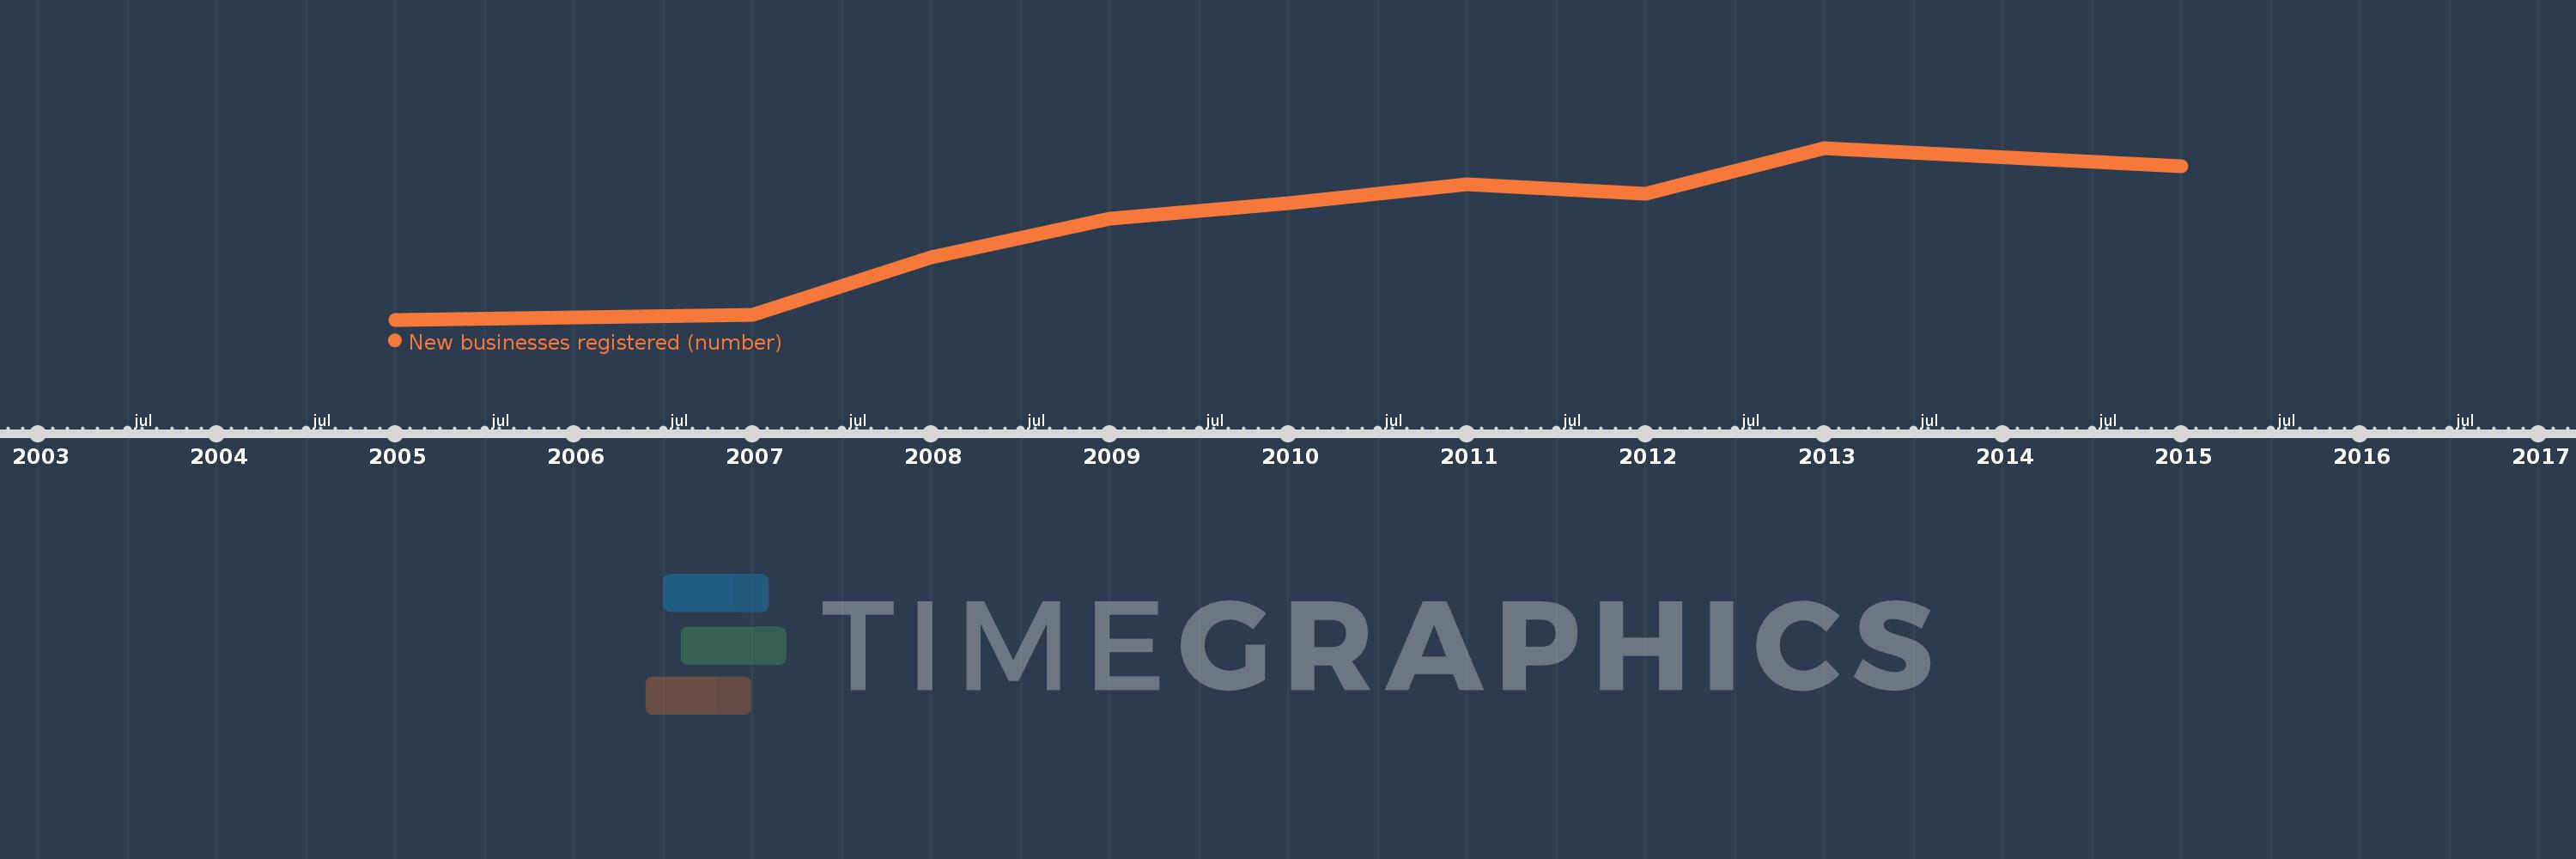
Questa scala temporale mostra un grafico dal 2005 anno al 2015 anno. Belarus. I dati fino ad 2004 anno non disponibili. Il numero di osservazioni attuali secondo i date: 10.
La fonte (nome):
Indicatori dello sviluppo mondiale
La fonte (organizzazione):
World Bank's Entrepreneurship Survey and database (http://econ.worldbank.org/research/entrepreneurship).
Categorie:
Private Sector
sono stati aggiornati
23 apr 2017 anni
Indicatori delle variazioni dei valori per anni
In media:
4.693 Mille.
Minima:
1.606 Mille.
1 gen 2005 anni
Massimo:
7.674 Mille.
1 gen 2013 anni
Alla data di osservazione
Valore
Variazione assoluta
La variazione rispetto al valore precedente
1 gen 2005 anni
1.606 Mille.
+1.606 Mille.
0.0%
1 gen 2006 anni
1.68 Mille.
+74.0
4.61%
1 gen 2007 anni
1.783 Mille.
+103.0
6.13%
1 gen 2008 anni
3.82 Mille.
+2.037 Mille.
114.25%
1 gen 2009 anni
5.168 Mille.
+1.348 Mille.
35.29%
1 gen 2010 anni
5.714 Mille.
+546.0
10.57%
1 gen 2011 anni
6.399 Mille.
+685.0
11.99%
1 gen 2012 anni
6.063 Mille.
-336.0
-5.25%
1 gen 2013 anni
7.674 Mille.
+1.611 Mille.
26.57%
1 gen 2015 anni
7.019 Mille.
-655.0
-8.54%
Classificazione dei paesi secondo i statistiche attuali per anni