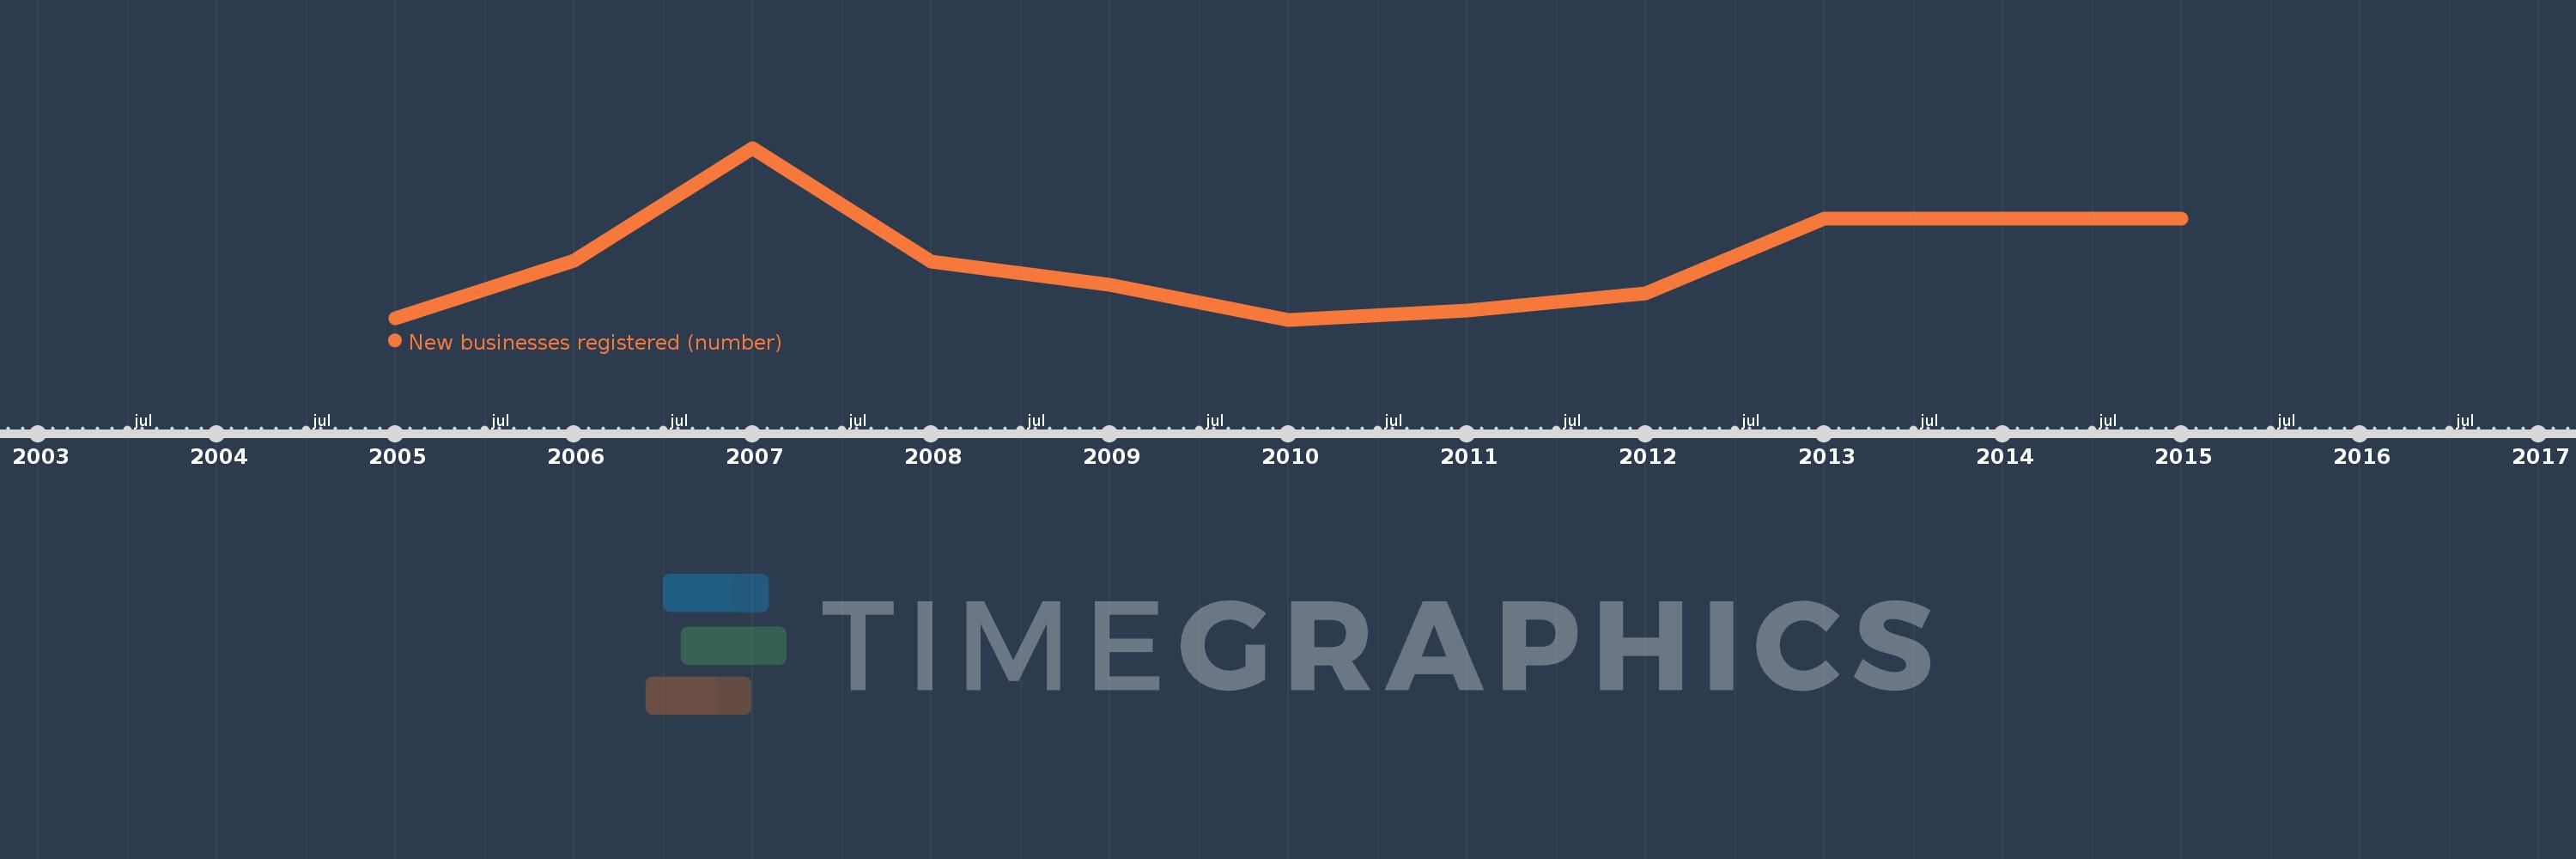
Questa scala temporale mostra un grafico dal 2005 anno al 2015 anno. Norway. I dati fino ad 2004 anno non disponibili. Il numero di osservazioni attuali secondo i date: 10.
La fonte (nome):
Indicatori dello sviluppo mondiale
La fonte (organizzazione):
World Bank's Entrepreneurship Survey and database (http://econ.worldbank.org/research/entrepreneurship).
Categorie:
Private Sector
sono stati aggiornati
23 apr 2017 anni
Indicatori delle variazioni dei valori per anni
In media:
20.175 Mille.
Minima:
13.016 Mille.
1 gen 2010 anni
Massimo:
34.849 Mille.
1 gen 2007 anni
Alla data di osservazione
Valore
Variazione assoluta
La variazione rispetto al valore precedente
1 gen 2005 anni
13.225 Mille.
+13.225 Mille.
0.0%
1 gen 2006 anni
20.497 Mille.
+7.272 Mille.
54.99%
1 gen 2007 anni
34.849 Mille.
+14.352 Mille.
70.02%
1 gen 2008 anni
20.395 Mille.
-14.454 Mille.
-41.48%
1 gen 2009 anni
17.465 Mille.
-2.93 Mille.
-14.37%
1 gen 2010 anni
13.016 Mille.
-4.449 Mille.
-25.47%
1 gen 2011 anni
14.145 Mille.
+1.129 Mille.
8.67%
1 gen 2012 anni
16.405 Mille.
+2.26 Mille.
15.98%
1 gen 2013 anni
25.87 Mille.
+9.465 Mille.
57.7%
1 gen 2015 anni
25.888 Mille.
+18.0
0.07%
Classificazione dei paesi secondo i statistiche attuali per anni