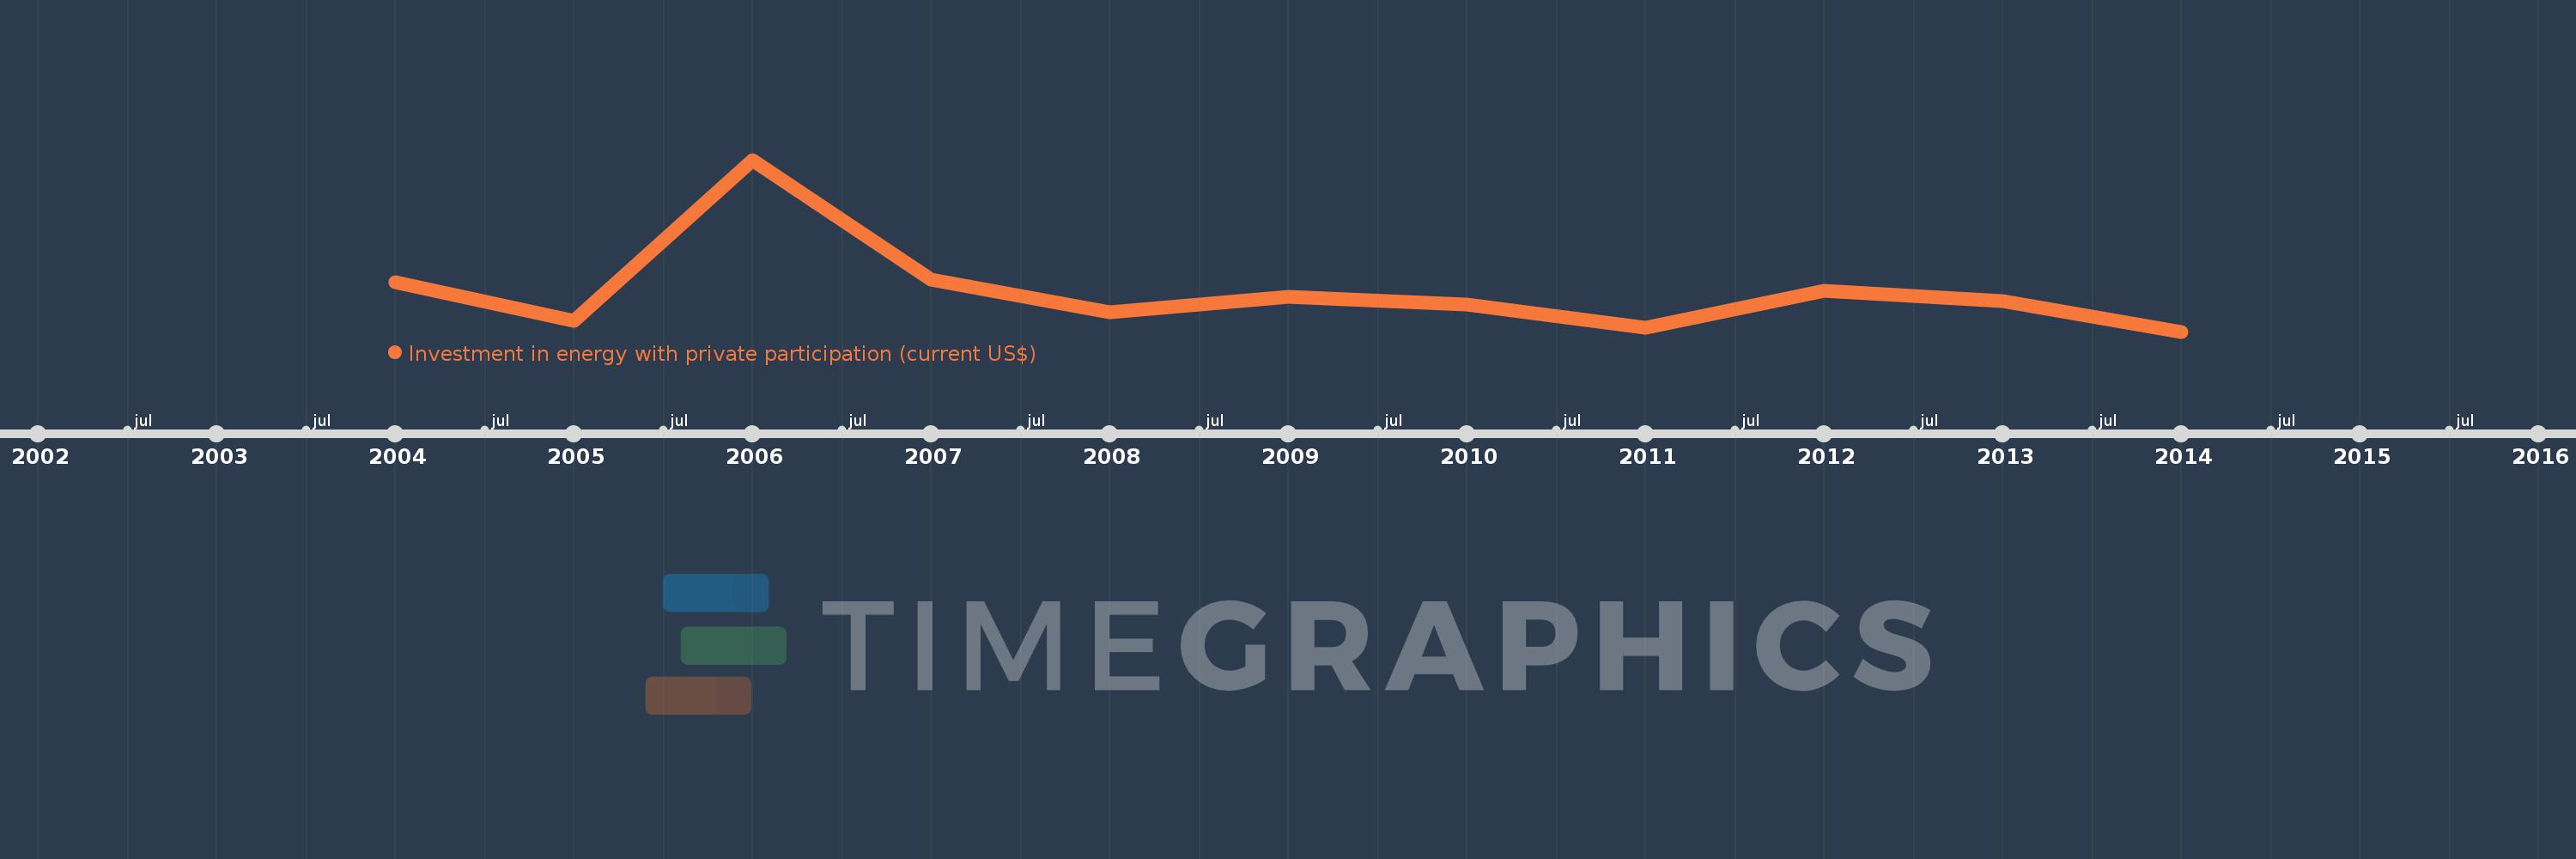
Questa scala temporale mostra un grafico dal 2004 anno al 2014 anno. Bulgaria. I dati fino ad 2003 anno non disponibili. Il numero di osservazioni attuali secondo i date: 11.
La fonte (nome):
Indicatori dello sviluppo mondiale
La fonte (organizzazione):
World Bank, Private Participation in Infrastructure Project Database (http://ppi.worldbank.org).
Categorie:
Energy & Mining, Infrastructure, Private Sector
sono stati aggiornati
23 apr 2017 anni
Indicatori delle variazioni dei valori per anni
In media:
672.357 Mln
Minima:
165.0 Mln
1 gen 2014 anni
Massimo:
2.342 Mlrd
1 gen 2006 anni
Alla data di osservazione
Valore
Variazione assoluta
La variazione rispetto al valore precedente
1 gen 2004 anni
793.6 Mln
+793.6 Mln
0.0%
1 gen 2005 anni
300.8 Mln
-492.8 Mln
-62.1%
1 gen 2006 anni
2.342 Mlrd
+2.041 Mlrd
678.62%
1 gen 2007 anni
826.1 Mln
-1.516 Mlrd
-64.73%
1 gen 2008 anni
410.5 Mln
-415.6 Mln
-50.31%
1 gen 2009 anni
607.86 Mln
+197.36 Mln
48.08%
1 gen 2010 anni
503.8 Mln
-104.06 Mln
-17.12%
1 gen 2011 anni
216.24 Mln
-287.56 Mln
-57.08%
1 gen 2012 anni
679.25 Mln
+463.01 Mln
214.12%
1 gen 2013 anni
550.68 Mln
-128.57 Mln
-18.93%
1 gen 2014 anni
165.0 Mln
-385.68 Mln
-70.04%
Classificazione dei paesi secondo i statistiche attuali per anni