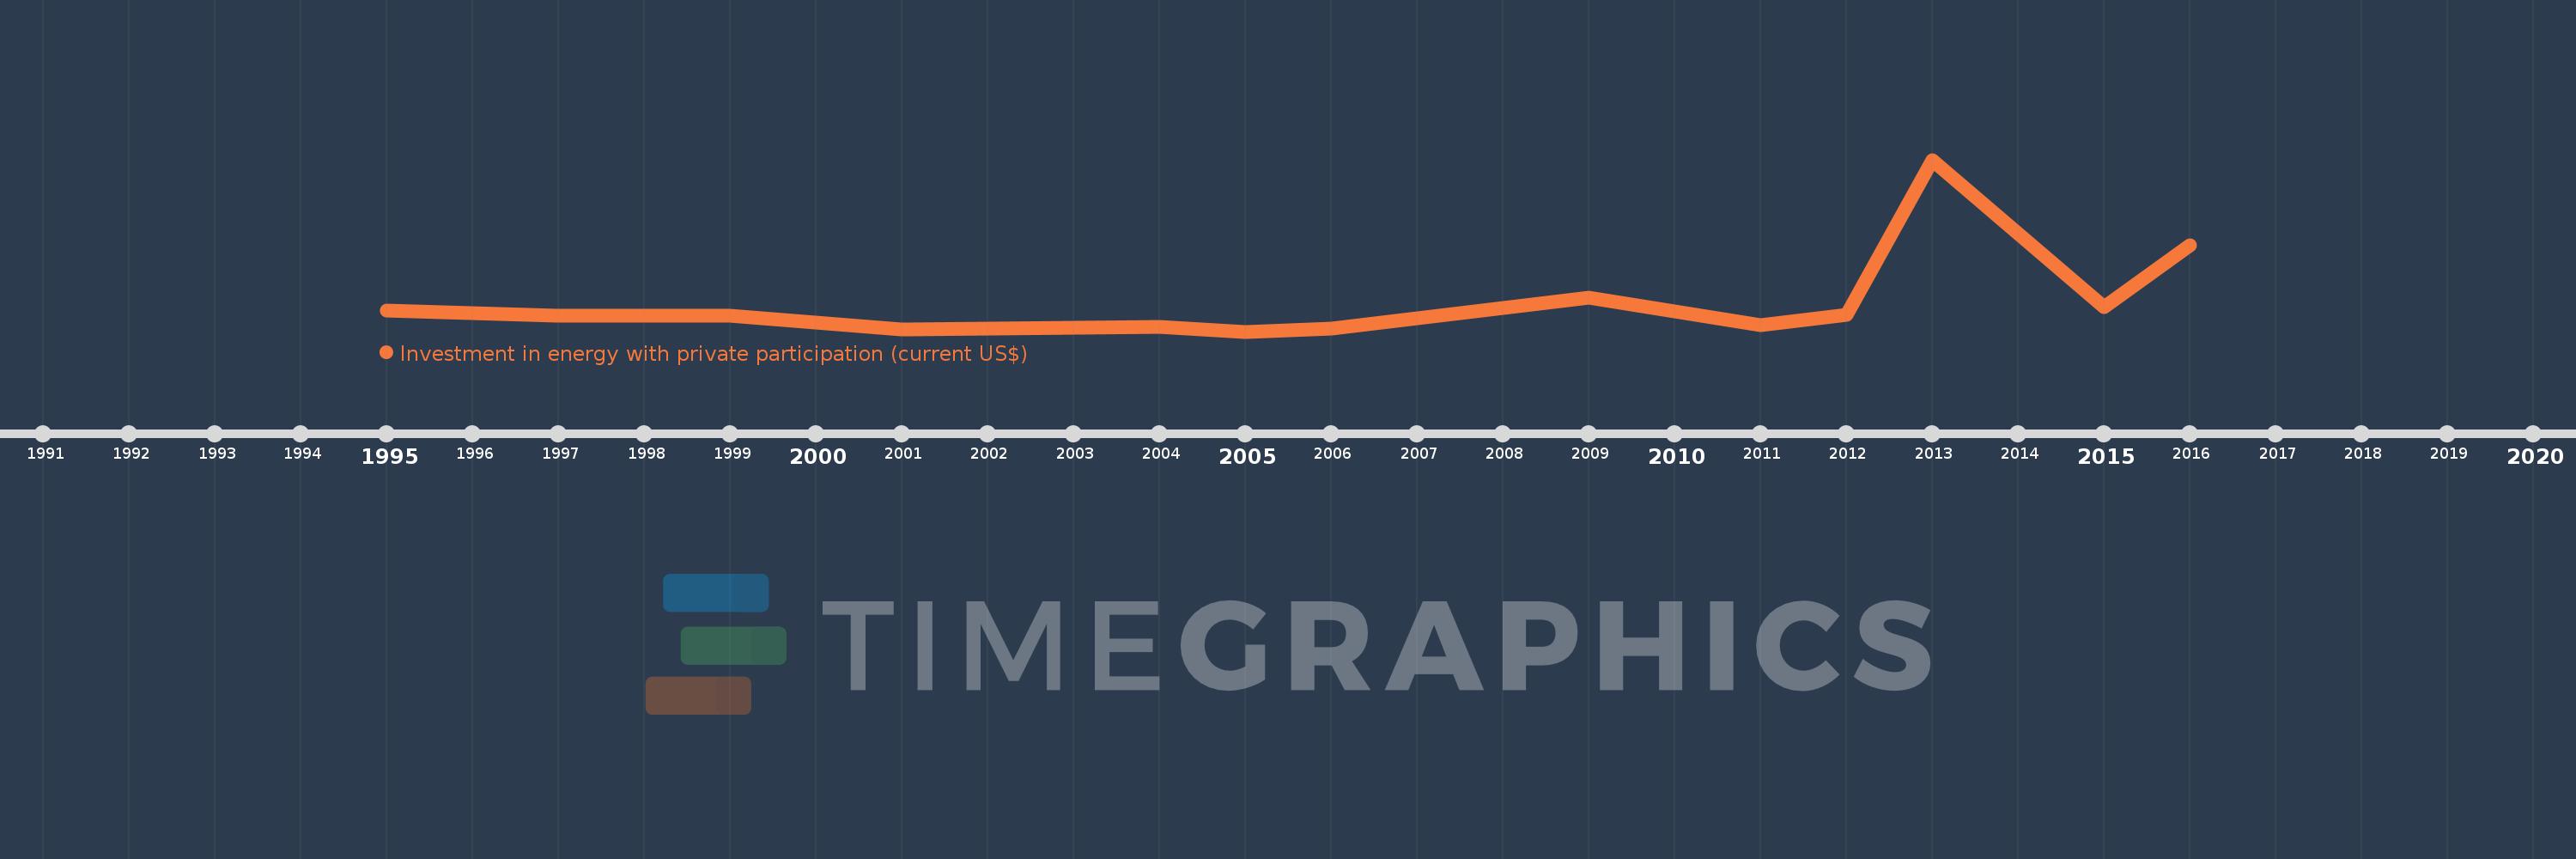
Questa scala temporale mostra un grafico dal 1995 anno al 2016 anno. Nepal. I dati fino ad 1994 anno non disponibili. Il numero di osservazioni attuali secondo i date: 13.
La fonte (nome):
Indicatori dello sviluppo mondiale
La fonte (organizzazione):
World Bank, Private Participation in Infrastructure Project Database (http://ppi.worldbank.org).
Categorie:
Energy & Mining, Infrastructure, Private Sector
sono stati aggiornati
23 apr 2017 anni
Indicatori delle variazioni dei valori per anni
In media:
188.073 Mln
Minima:
500.0 Mille.
1 gen 2005 anni
Massimo:
1.042 Mlrd
1 gen 2013 anni
Alla data di osservazione
Valore
Variazione assoluta
La variazione rispetto al valore precedente
1 gen 1995 anni
125.7 Mln
+125.7 Mln
0.0%
1 gen 1997 anni
98.2 Mln
-27.5 Mln
-21.88%
1 gen 1999 anni
98.0 Mln
-200.0 Mille.
-0.2%
1 gen 2001 anni
15.1 Mln
-82.9 Mln
-84.59%
1 gen 2004 anni
30.55 Mln
+15.45 Mln
102.32%
1 gen 2005 anni
500.0 Mille.
-30.05 Mln
-98.36%
1 gen 2006 anni
17.5 Mln
+17.0 Mln
3.4 Mille.%
1 gen 2009 anni
206.1 Mln
+188.6 Mln
1.08 Mille.%
1 gen 2011 anni
39.1 Mln
-167.0 Mln
-81.03%
1 gen 2012 anni
101.2 Mln
+62.1 Mln
158.82%
1 gen 2013 anni
1.042 Mlrd
+940.4 Mln
929.25%
1 gen 2015 anni
147.4 Mln
-894.2 Mln
-85.85%
1 gen 2016 anni
524.0 Mln
+376.6 Mln
255.5%
Classificazione dei paesi secondo i statistiche attuali per anni