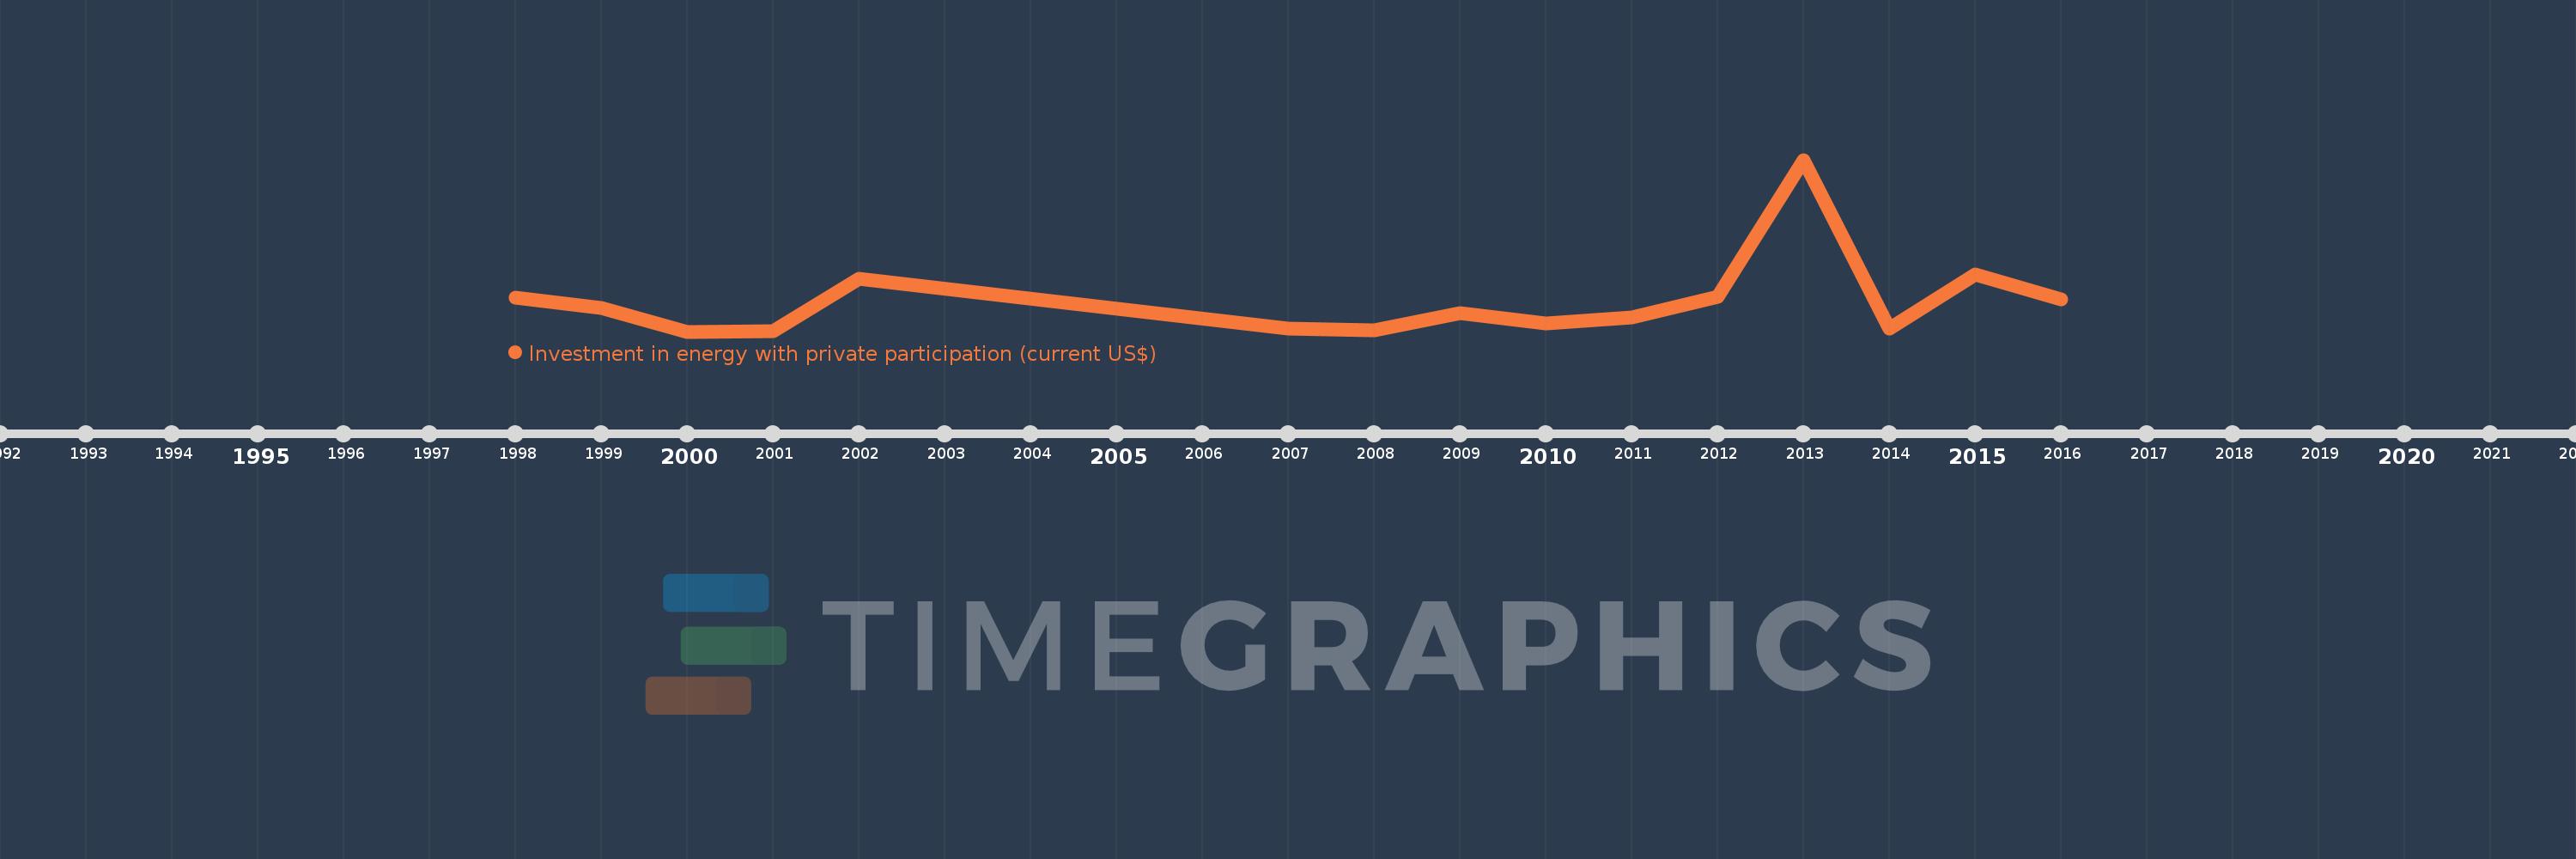
Questa scala temporale mostra un grafico dal 1998 anno al 2016 anno. Bangladesh. I dati fino ad 1997 anno non disponibili. Il numero di osservazioni attuali secondo i date: 15.
La fonte (nome):
Indicatori dello sviluppo mondiale
La fonte (organizzazione):
World Bank, Private Participation in Infrastructure Project Database (http://ppi.worldbank.org).
Categorie:
Energy & Mining, Infrastructure, Private Sector
sono stati aggiornati
23 apr 2017 anni
Indicatori delle variazioni dei valori per anni
In media:
282.428 Mln
Minima:
16.15 Mln
1 gen 2000 anni
Massimo:
1.528 Mlrd
1 gen 2013 anni
Alla data di osservazione
Valore
Variazione assoluta
La variazione rispetto al valore precedente
1 gen 1998 anni
313.7 Mln
+313.7 Mln
0.0%
1 gen 1999 anni
225.0 Mln
-88.7 Mln
-28.28%
1 gen 2000 anni
16.15 Mln
-208.85 Mln
-92.82%
1 gen 2001 anni
18.5 Mln
+2.35 Mln
14.55%
1 gen 2002 anni
483.0 Mln
+464.5 Mln
2.51 Mille.%
1 gen 2007 anni
40.5 Mln
-442.5 Mln
-91.61%
1 gen 2008 anni
25.4 Mln
-15.1 Mln
-37.28%
1 gen 2009 anni
177.4 Mln
+152.0 Mln
598.43%
1 gen 2010 anni
88.53 Mln
-88.87 Mln
-50.1%
1 gen 2011 anni
137.13 Mln
+48.6 Mln
54.9%
1 gen 2012 anni
324.507 Mln
+187.377 Mln
136.64%
1 gen 2013 anni
1.528 Mlrd
+1.203 Mlrd
370.81%
1 gen 2014 anni
40.3 Mln
-1.488 Mlrd
-97.36%
1 gen 2015 anni
518.5 Mln
+478.2 Mln
1.19 Mille.%
1 gen 2016 anni
300.0 Mln
-218.5 Mln
-42.14%
Classificazione dei paesi secondo i statistiche attuali per anni