Download Queste statistiche in altri paesi:
Linea del tempo:
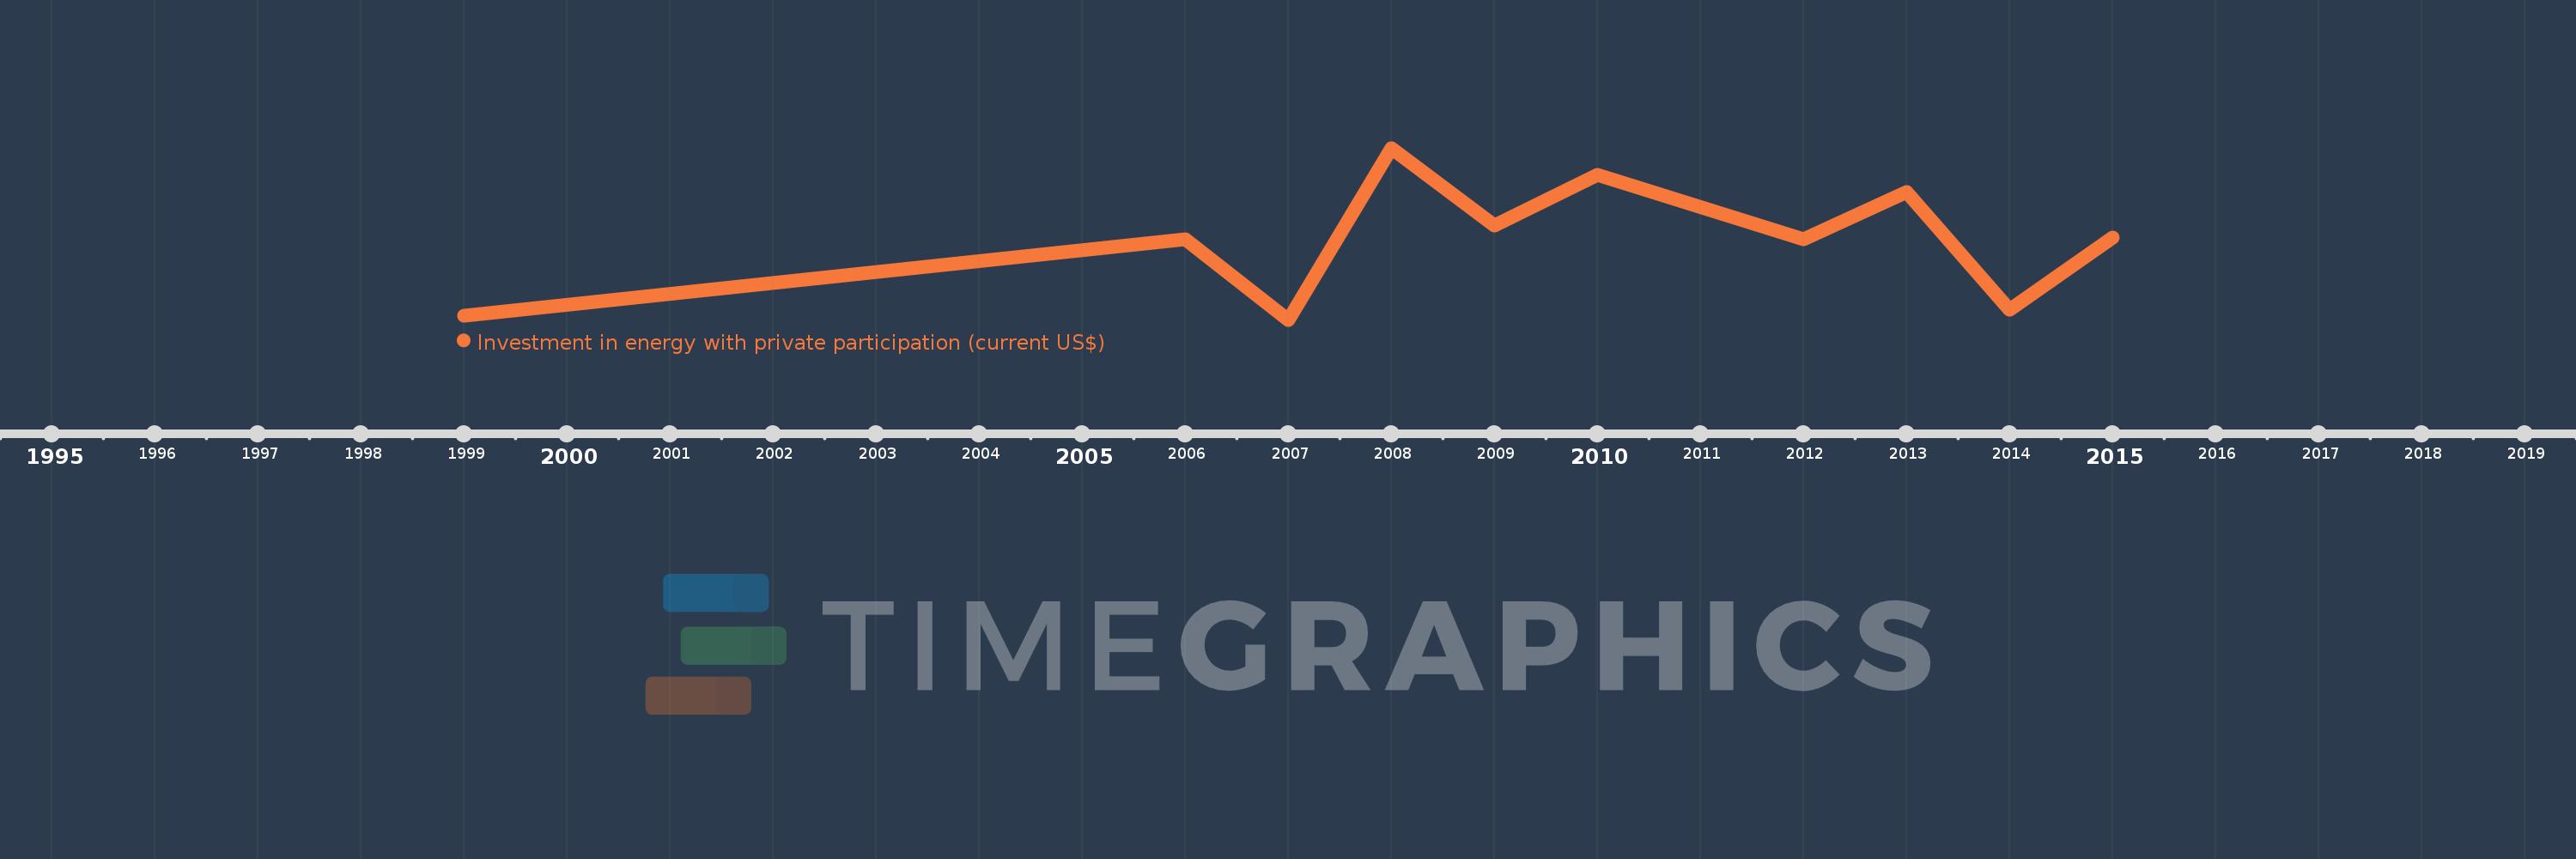
Questa scala temporale mostra un grafico dal 1999 anno al 2015 anno. Romania. I dati fino ad 1998 anno non disponibili. Il numero di osservazioni attuali secondo i date: 10.
La fonte (nome):
Indicatori dello sviluppo mondiale
La fonte (organizzazione):
World Bank, Private Participation in Infrastructure Project Database (http://ppi.worldbank.org).
Categorie:
Energy & Mining, Infrastructure, Private Sector
sono stati aggiornati
23 apr 2017 anni
Indicatori delle variazioni dei valori per anni
Minima:
45.0 Mln
1 gen 2007 anni
Massimo:
2.6 Mlrd
1 gen 2008 anni
Alla data di osservazione
Valore
Variazione assoluta
La variazione rispetto al valore precedente
1 gen 1999 anni
100.0 Mln
+100.0 Mln
0.0%
1 gen 2006 anni
1.241 Mlrd
+1.141 Mlrd
1.14 Mille.%
1 gen 2007 anni
45.0 Mln
-1.196 Mlrd
-96.37%
1 gen 2008 anni
2.6 Mlrd
+2.555 Mlrd
5.68 Mille.%
1 gen 2009 anni
1.448 Mlrd
-1.153 Mlrd
-44.33%
1 gen 2010 anni
2.196 Mlrd
+748.7 Mln
51.72%
1 gen 2012 anni
1.238 Mlrd
-957.96 Mln
-43.62%
1 gen 2013 anni
1.943 Mlrd
+705.06 Mln
56.94%
1 gen 2014 anni
189.0 Mln
-1.754 Mlrd
-90.27%
1 gen 2015 anni
1.266 Mlrd
+1.077 Mlrd
569.58%
Classificazione dei paesi secondo i statistiche attuali per anni