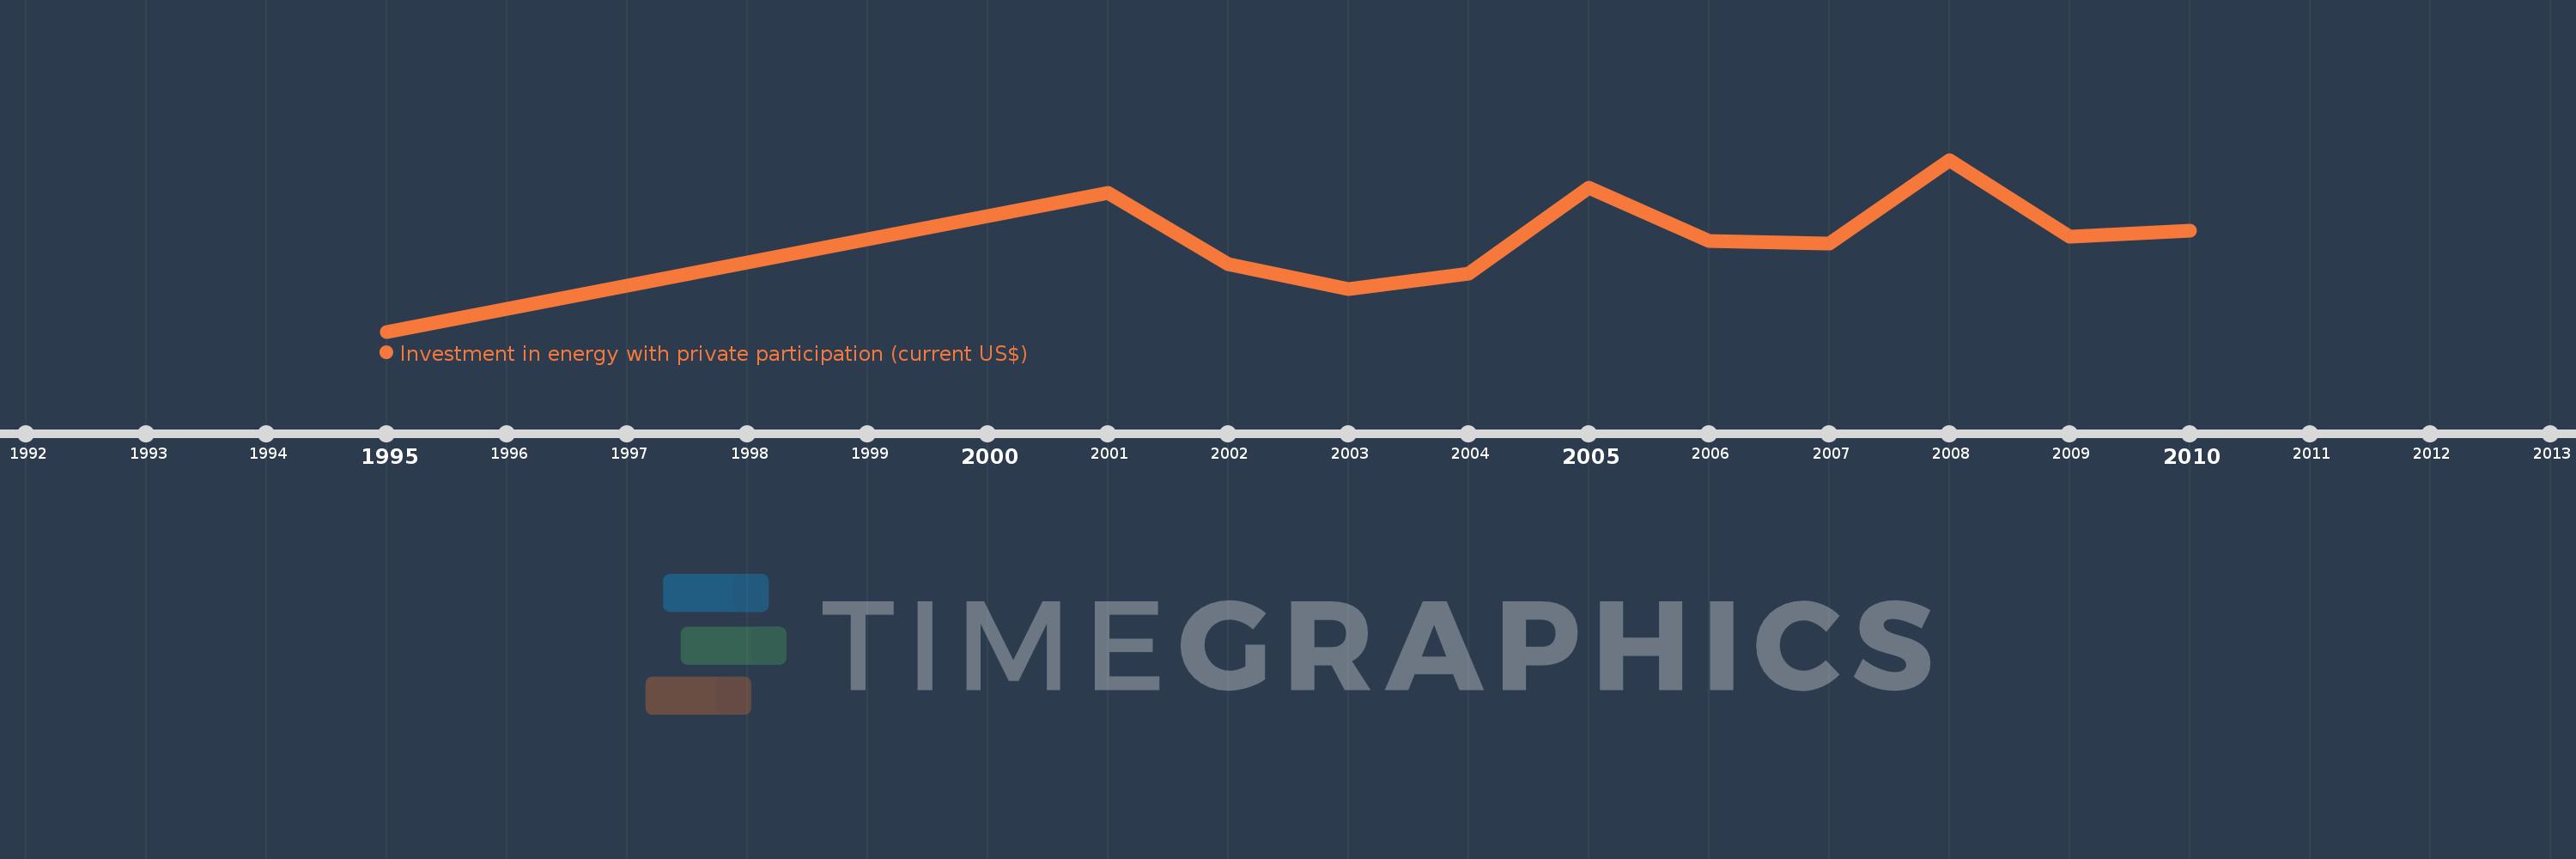
Questa scala temporale mostra un grafico dal 1995 anno al 2010 anno. St. Lucia. I dati fino ad 1994 anno non disponibili. Il numero di osservazioni attuali secondo i date: 11.
La fonte (nome):
Indicatori dello sviluppo mondiale
La fonte (organizzazione):
World Bank, Private Participation in Infrastructure Project Database (http://ppi.worldbank.org).
Categorie:
Energy & Mining, Infrastructure, Private Sector
sono stati aggiornati
23 apr 2017 anni
Indicatori delle variazioni dei valori per anni
In media:
10.018 Mln
Minima:
0.0
1 gen 1995 anni
Massimo:
19.0 Mln
1 gen 2008 anni
Alla data di osservazione
Valore
Variazione assoluta
La variazione rispetto al valore precedente
1 gen 1995 anni
0.0
0.0
0.0%
1 gen 2001 anni
15.3 Mln
+15.3 Mln
%
1 gen 2002 anni
7.5 Mln
-7.8 Mln
-50.98%
1 gen 2003 anni
4.7 Mln
-2.8 Mln
-37.33%
1 gen 2004 anni
6.4 Mln
+1.7 Mln
36.17%
1 gen 2005 anni
15.9 Mln
+9.5 Mln
148.44%
1 gen 2006 anni
10.0 Mln
-5.9 Mln
-37.11%
1 gen 2007 anni
9.7 Mln
-300.0 Mille.
-3.0%
1 gen 2008 anni
19.0 Mln
+9.3 Mln
95.88%
1 gen 2009 anni
10.5 Mln
-8.5 Mln
-44.74%
1 gen 2010 anni
11.2 Mln
+700.0 Mille.
6.67%
Classificazione dei paesi secondo i statistiche attuali per anni