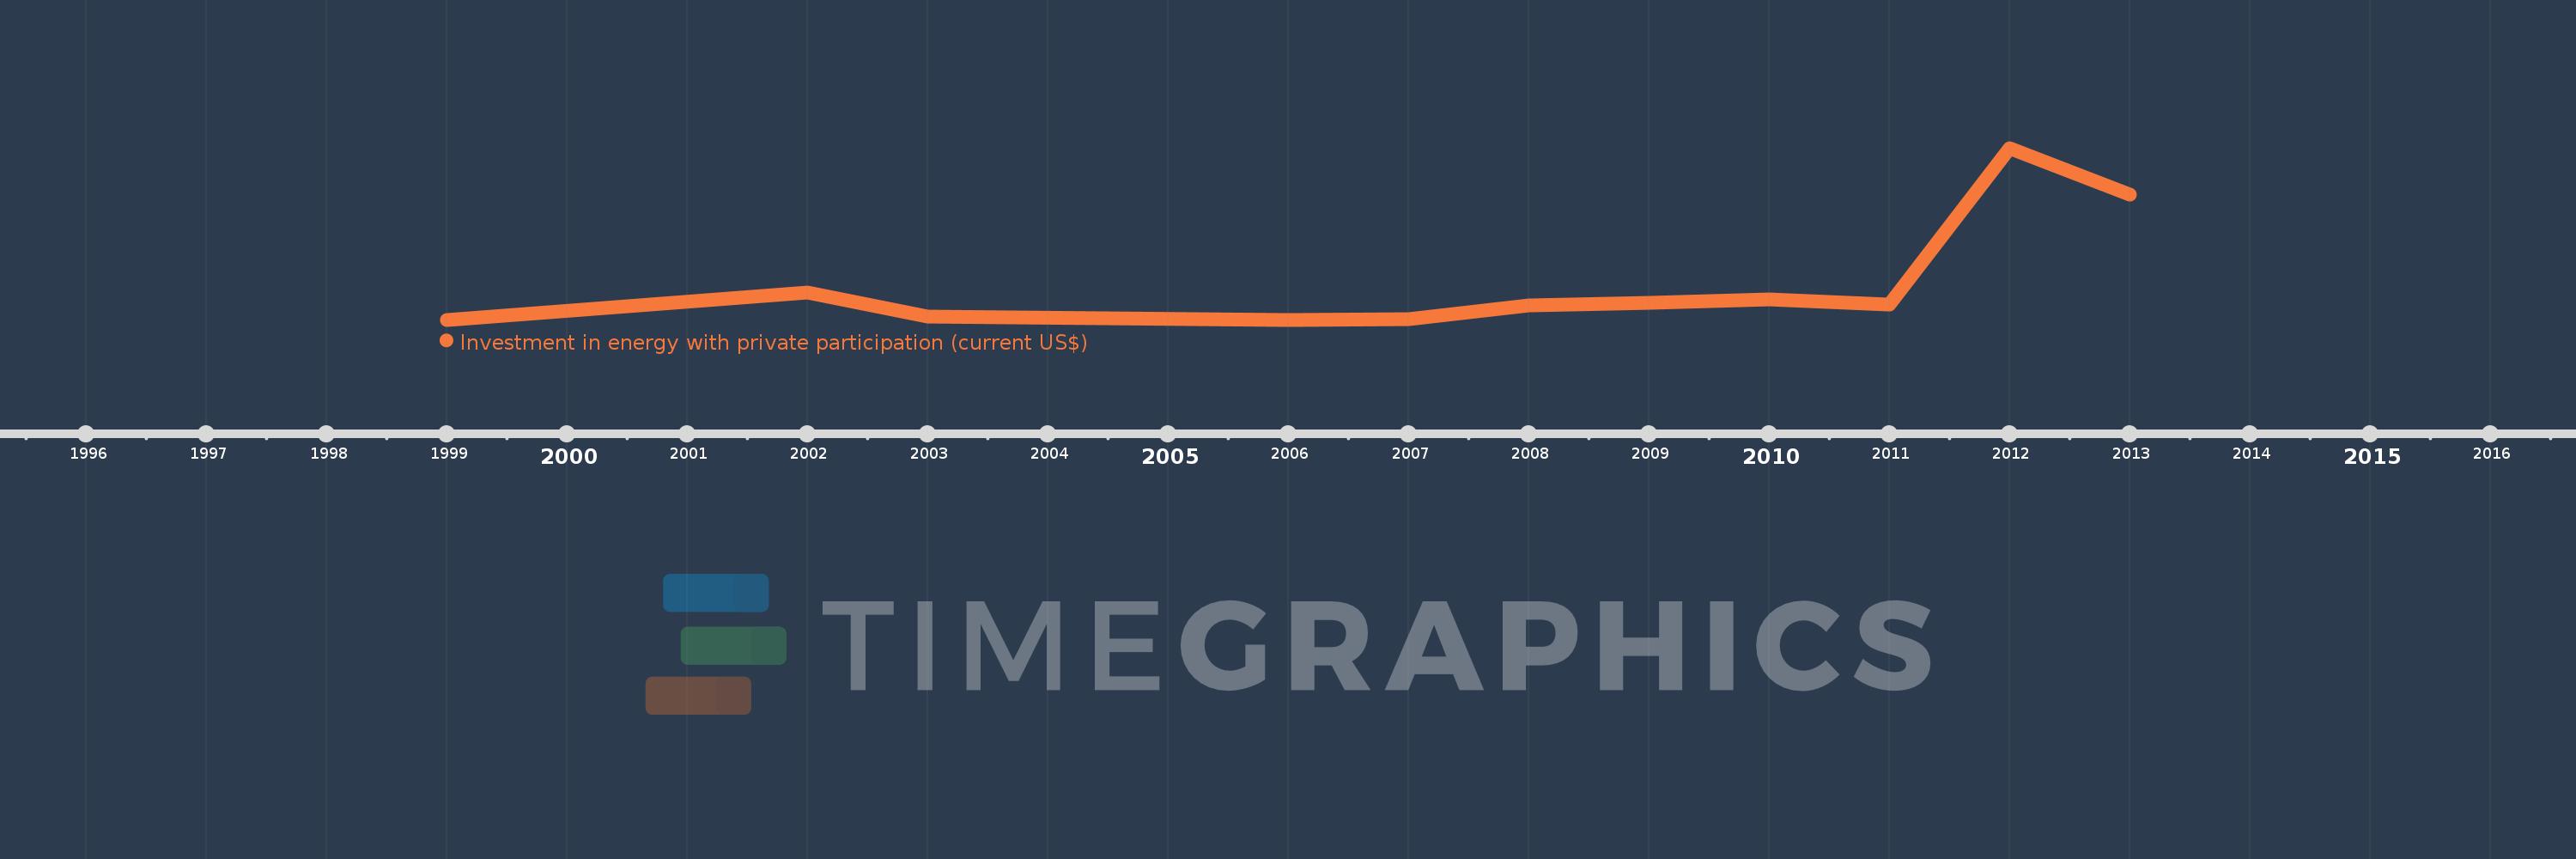
Questa scala temporale mostra un grafico dal 1999 anno al 2013 anno. Ukraine. I dati fino ad 1998 anno non disponibili. Il numero di osservazioni attuali secondo i date: 11.
La fonte (nome):
Indicatori dello sviluppo mondiale
La fonte (organizzazione):
World Bank, Private Participation in Infrastructure Project Database (http://ppi.worldbank.org).
Categorie:
Energy & Mining, Infrastructure, Private Sector
sono stati aggiornati
23 apr 2017 anni
Indicatori delle variazioni dei valori per anni
In media:
209.031 Mln
Minima:
0.0
1 gen 1999 anni
Massimo:
997.8 Mln
1 gen 2012 anni
Alla data di osservazione
Valore
Variazione assoluta
La variazione rispetto al valore precedente
1 gen 1999 anni
0.0
0.0
0.0%
1 gen 2002 anni
160.0 Mln
+160.0 Mln
%
1 gen 2003 anni
20.0 Mln
-140.0 Mln
-87.5%
1 gen 2006 anni
0.0
-20.0 Mln
-100.0%
1 gen 2007 anni
3.9 Mln
+3.9 Mln
%
1 gen 2008 anni
83.4 Mln
+79.5 Mln
2.04 Mille.%
1 gen 2009 anni
100.14 Mln
+16.74 Mln
20.07%
1 gen 2010 anni
120.69 Mln
+20.55 Mln
20.52%
1 gen 2011 anni
88.91 Mln
-31.78 Mln
-26.33%
1 gen 2012 anni
997.8 Mln
+908.89 Mln
1.02 Mille.%
1 gen 2013 anni
724.5 Mln
-273.3 Mln
-27.39%
Classificazione dei paesi secondo i statistiche attuali per anni