Download Queste statistiche in altri paesi:
Linea del tempo:
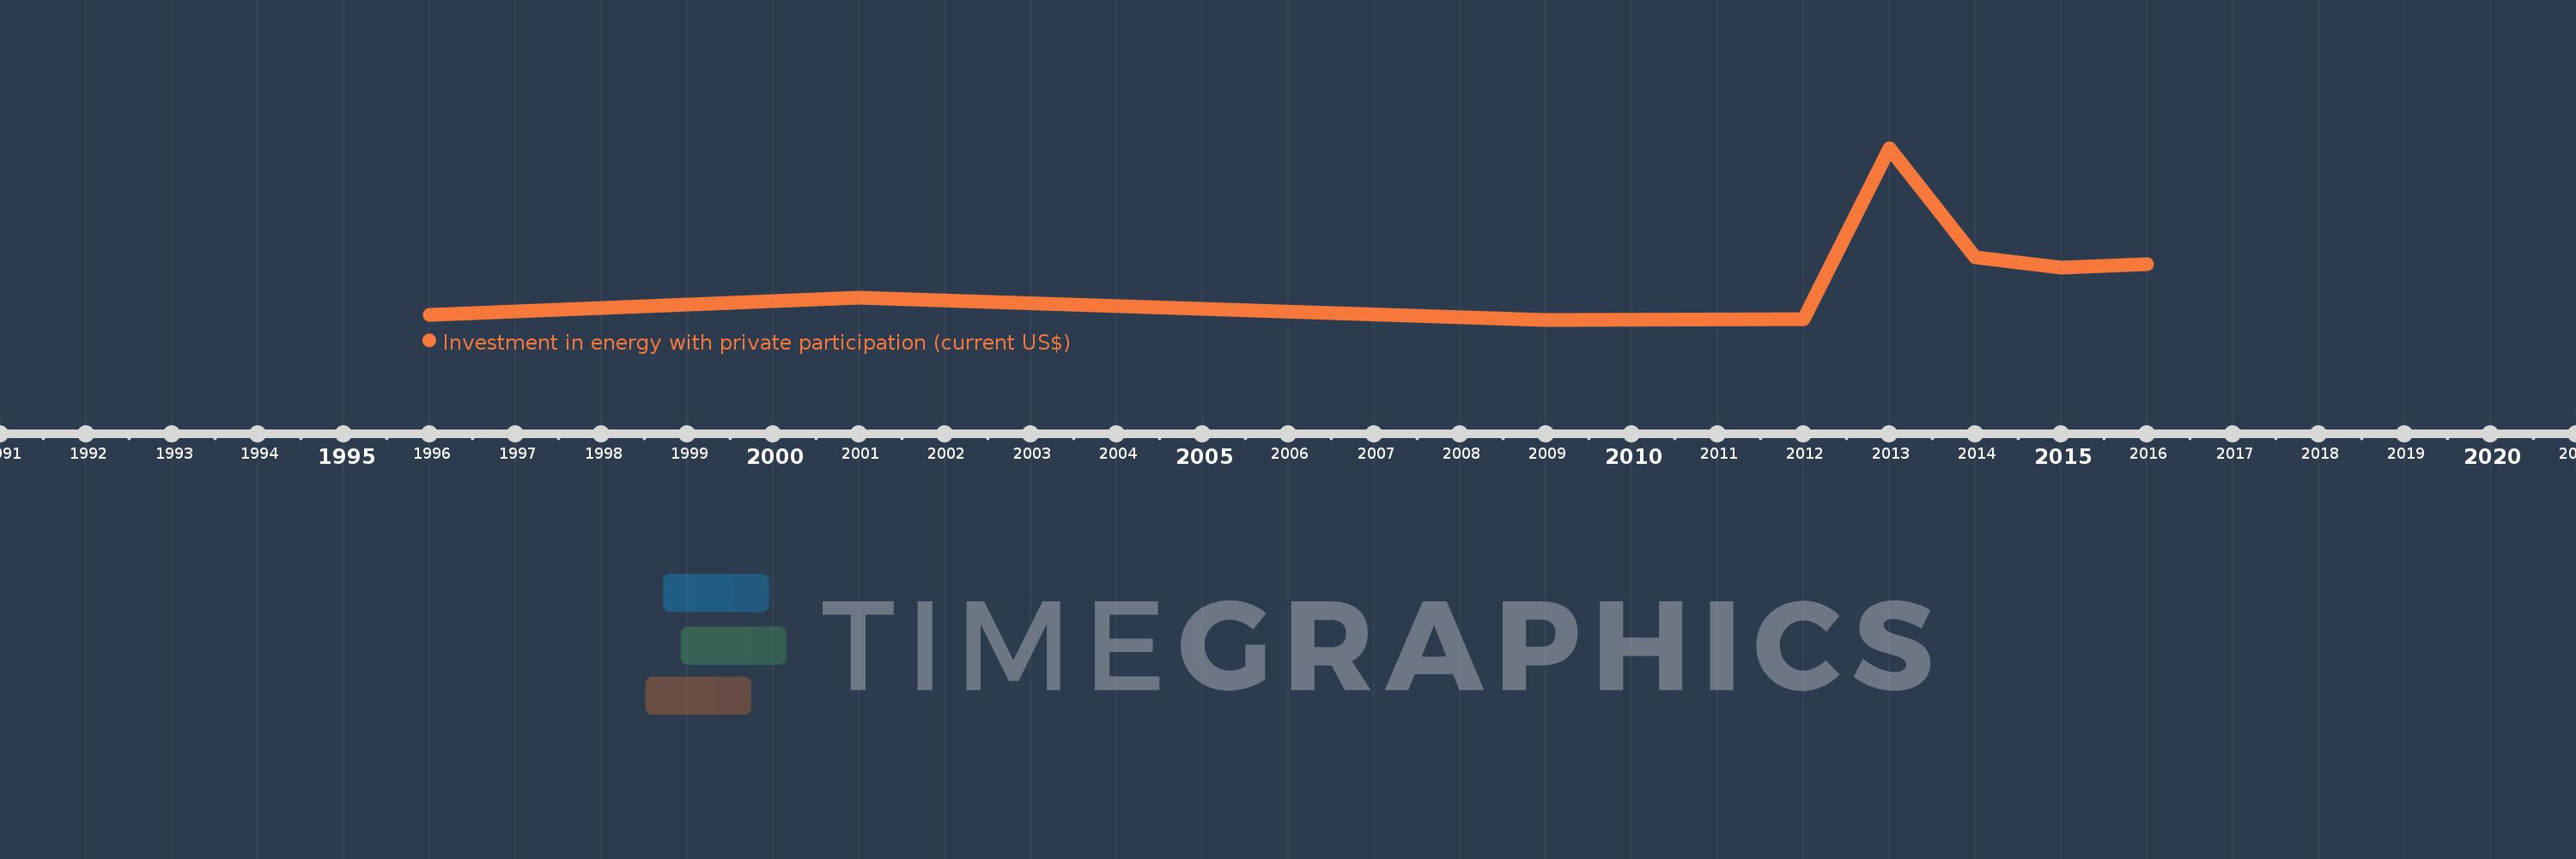
Questa scala temporale mostra un grafico dal 1996 anno al 2016 anno. Uruguay. I dati fino ad 1995 anno non disponibili. Il numero di osservazioni attuali secondo i date: 8.
La fonte (nome):
Indicatori dello sviluppo mondiale
La fonte (organizzazione):
World Bank, Private Participation in Infrastructure Project Database (http://ppi.worldbank.org).
Categorie:
Energy & Mining, Infrastructure, Private Sector
sono stati aggiornati
23 apr 2017 anni
Indicatori delle variazioni dei valori per anni
Minima:
15.0 Mln
1 gen 2009 anni
Massimo:
2.421 Mlrd
1 gen 2013 anni
Alla data di osservazione
Valore
Variazione assoluta
La variazione rispetto al valore precedente
1 gen 1996 anni
86.0 Mln
+86.0 Mln
0.0%
1 gen 2001 anni
330.0 Mln
+244.0 Mln
283.72%
1 gen 2009 anni
15.0 Mln
-315.0 Mln
-95.45%
1 gen 2012 anni
20.0 Mln
+5.0 Mln
33.33%
1 gen 2013 anni
2.421 Mlrd
+2.401 Mlrd
12.01 Mille.%
1 gen 2014 anni
886.2 Mln
-1.535 Mlrd
-63.4%
1 gen 2015 anni
747.5 Mln
-138.7 Mln
-15.65%
1 gen 2016 anni
793.6 Mln
+46.1 Mln
6.17%
Classificazione dei paesi secondo i statistiche attuali per anni