Download Queste statistiche in altri paesi:
Linea del tempo:
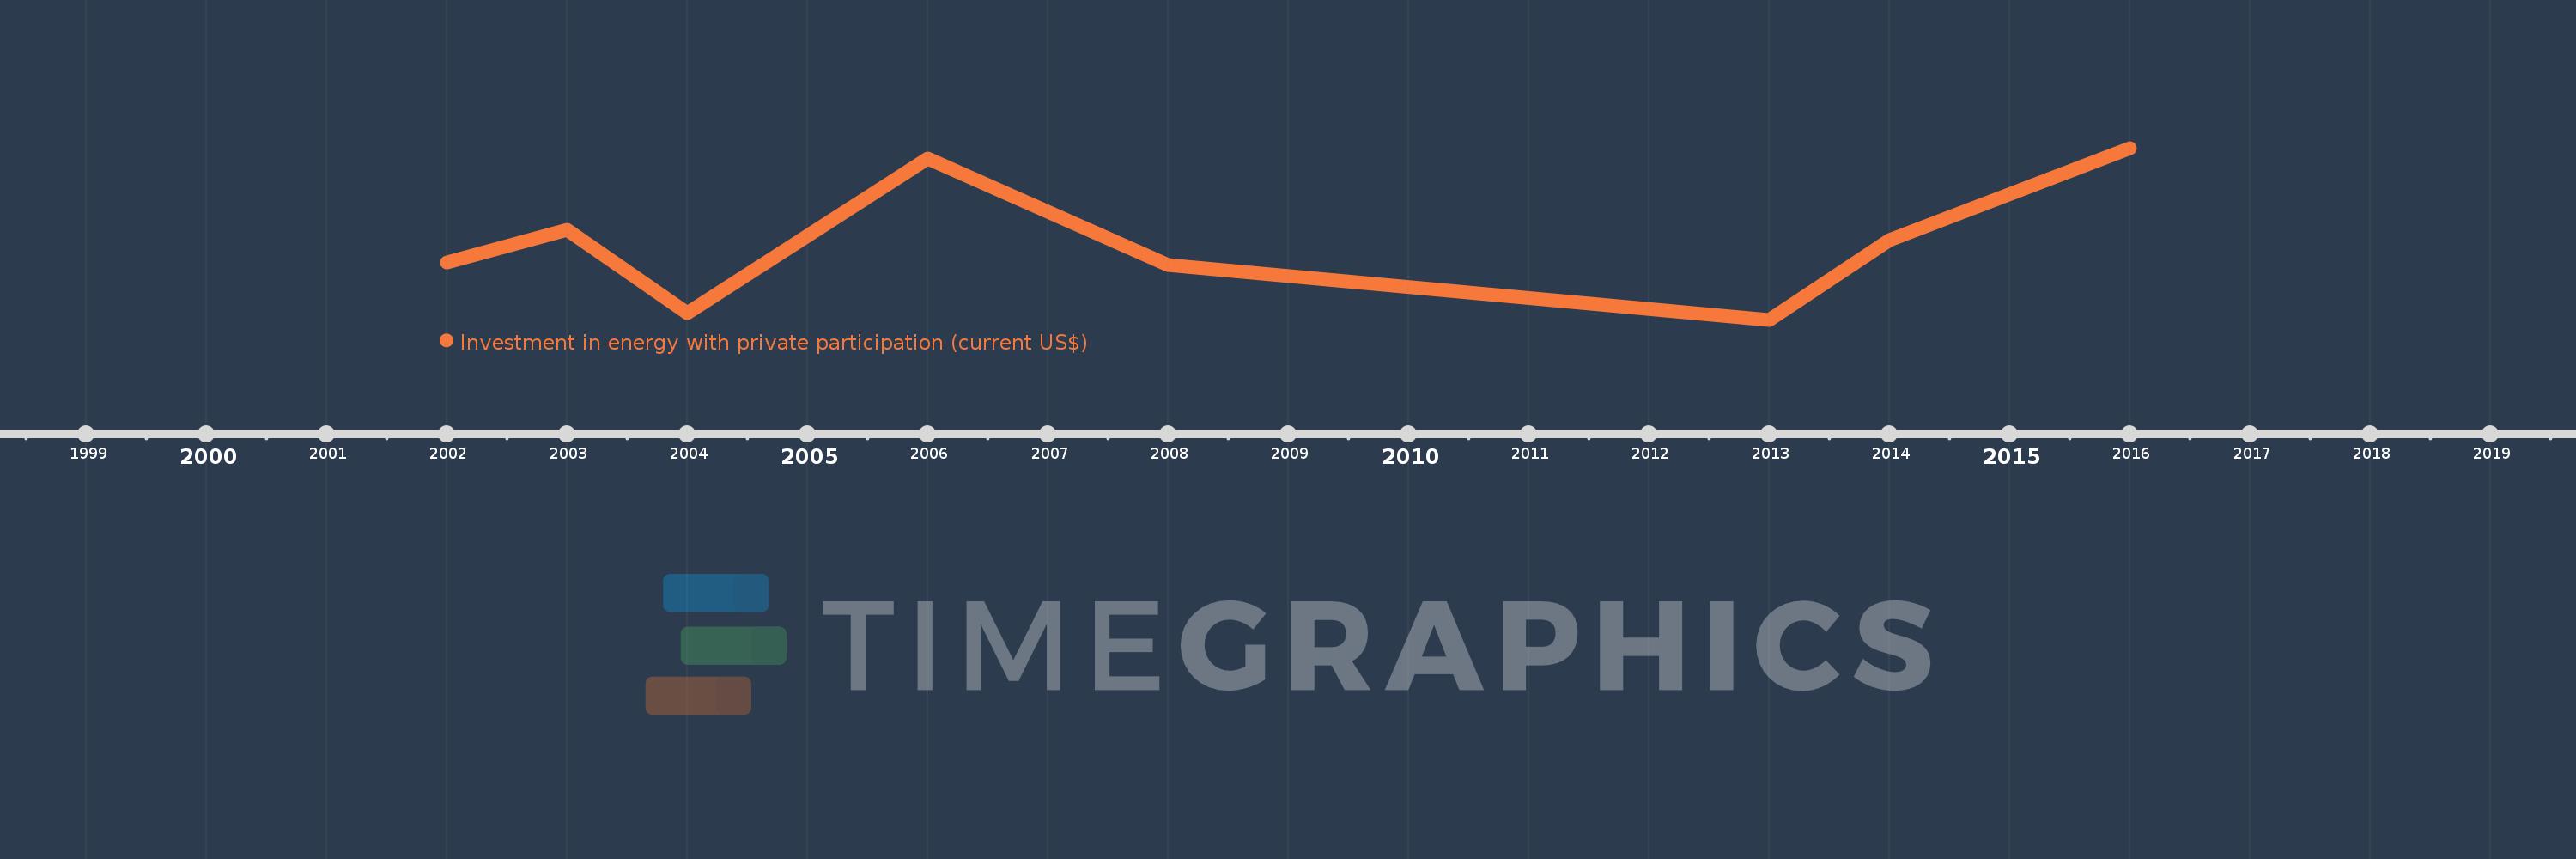
Questa scala temporale mostra un grafico dal 2002 anno al 2016 anno. Nigeria. I dati fino ad 2001 anno non disponibili. Il numero di osservazioni attuali secondo i date: 8.
La fonte (nome):
Indicatori dello sviluppo mondiale
La fonte (organizzazione):
World Bank, Private Participation in Infrastructure Project Database (http://ppi.worldbank.org).
Categorie:
Energy & Mining, Infrastructure, Private Sector
sono stati aggiornati
23 apr 2017 anni
Indicatori delle variazioni dei valori per anni
Minima:
0.0
1 gen 2013 anni
Massimo:
880.0 Mln
1 gen 2016 anni
Alla data di osservazione
Valore
Variazione assoluta
La variazione rispetto al valore precedente
1 gen 2002 anni
295.0 Mln
+295.0 Mln
0.0%
1 gen 2003 anni
462.0 Mln
+167.0 Mln
56.61%
1 gen 2004 anni
34.0 Mln
-428.0 Mln
-92.64%
1 gen 2006 anni
828.0 Mln
+794.0 Mln
2.34 Mille.%
1 gen 2008 anni
280.0 Mln
-548.0 Mln
-66.18%
1 gen 2013 anni
0.0
-280.0 Mln
-100.0%
1 gen 2014 anni
407.3 Mln
+407.3 Mln
%
1 gen 2016 anni
880.0 Mln
+472.7 Mln
116.06%
Classificazione dei paesi secondo i statistiche attuali per anni