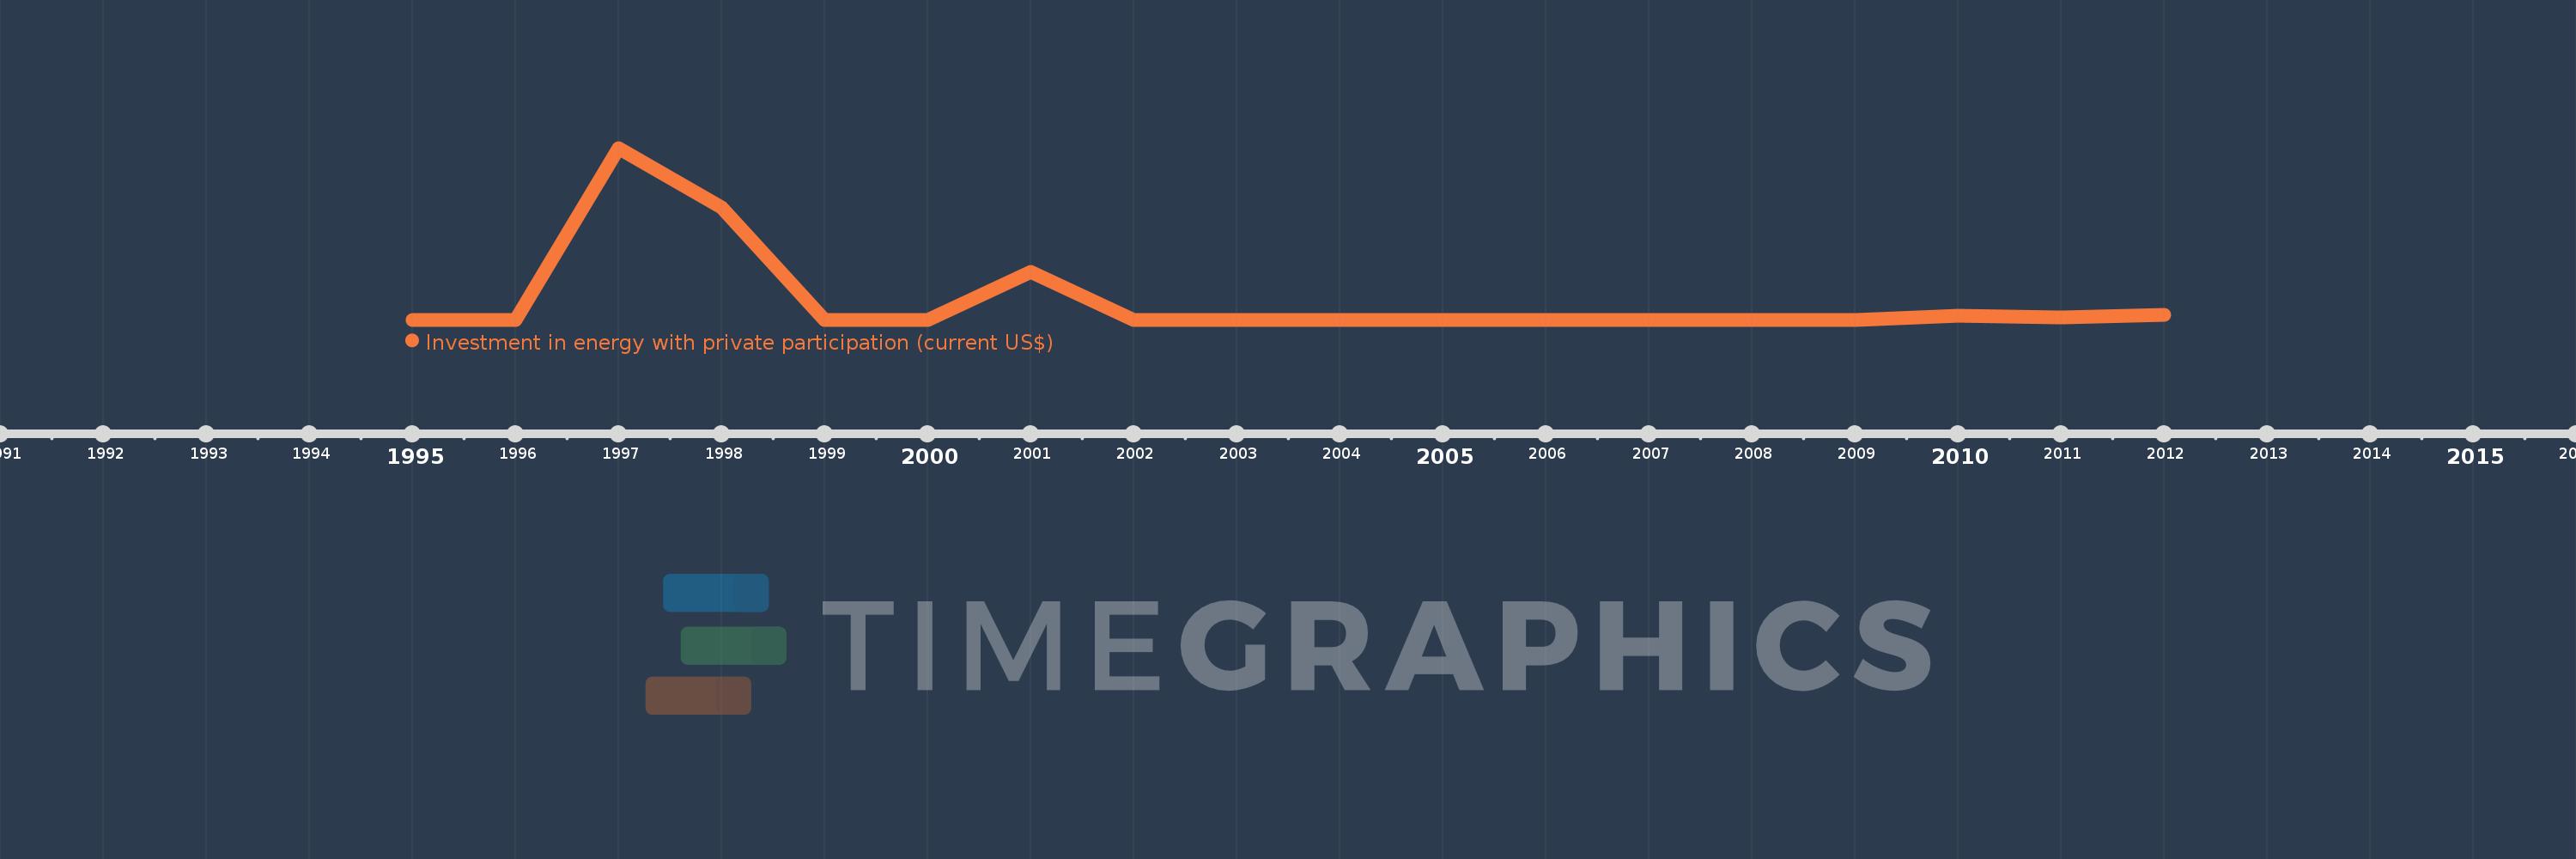
Questa scala temporale mostra un grafico dal 1995 anno al 2012 anno. Kazakhstan. I dati fino ad 1994 anno non disponibili. Il numero di osservazioni attuali secondo i date: 18.
La fonte (nome):
Indicatori dello sviluppo mondiale
La fonte (organizzazione):
World Bank, Private Participation in Infrastructure Project Database (http://ppi.worldbank.org).
Categorie:
Energy & Mining, Infrastructure, Private Sector
sono stati aggiornati
23 apr 2017 anni
Indicatori delle variazioni dei valori per anni
In media:
119.22 Mln
Minima:
0.0
1 gen 1995 anni
Massimo:
1.075 Mlrd
1 gen 1997 anni
Alla data di osservazione
Valore
Variazione assoluta
La variazione rispetto al valore precedente
1 gen 1995 anni
0.0
0.0
0.0%
1 gen 1996 anni
0.0
0.0
%
1 gen 1997 anni
1.075 Mlrd
+1.075 Mlrd
%
1 gen 1998 anni
705.19 Mln
-369.882 Mln
-34.41%
1 gen 1999 anni
0.0
-705.19 Mln
-100.0%
1 gen 2000 anni
0.0
0.0
%
1 gen 2001 anni
300.0 Mln
+300.0 Mln
%
1 gen 2002 anni
0.0
-300.0 Mln
-100.0%
1 gen 2003 anni
0.0
0.0
%
1 gen 2004 anni
0.0
0.0
%
1 gen 2005 anni
0.0
0.0
%
1 gen 2006 anni
0.0
0.0
%
1 gen 2007 anni
0.0
0.0
%
1 gen 2008 anni
0.0
0.0
%
1 gen 2009 anni
0.0
0.0
%
1 gen 2010 anni
23.0 Mln
+23.0 Mln
%
1 gen 2011 anni
14.5 Mln
-8.5 Mln
-36.96%
1 gen 2012 anni
28.2 Mln
+13.7 Mln
94.48%
Classificazione dei paesi secondo i statistiche attuali per anni