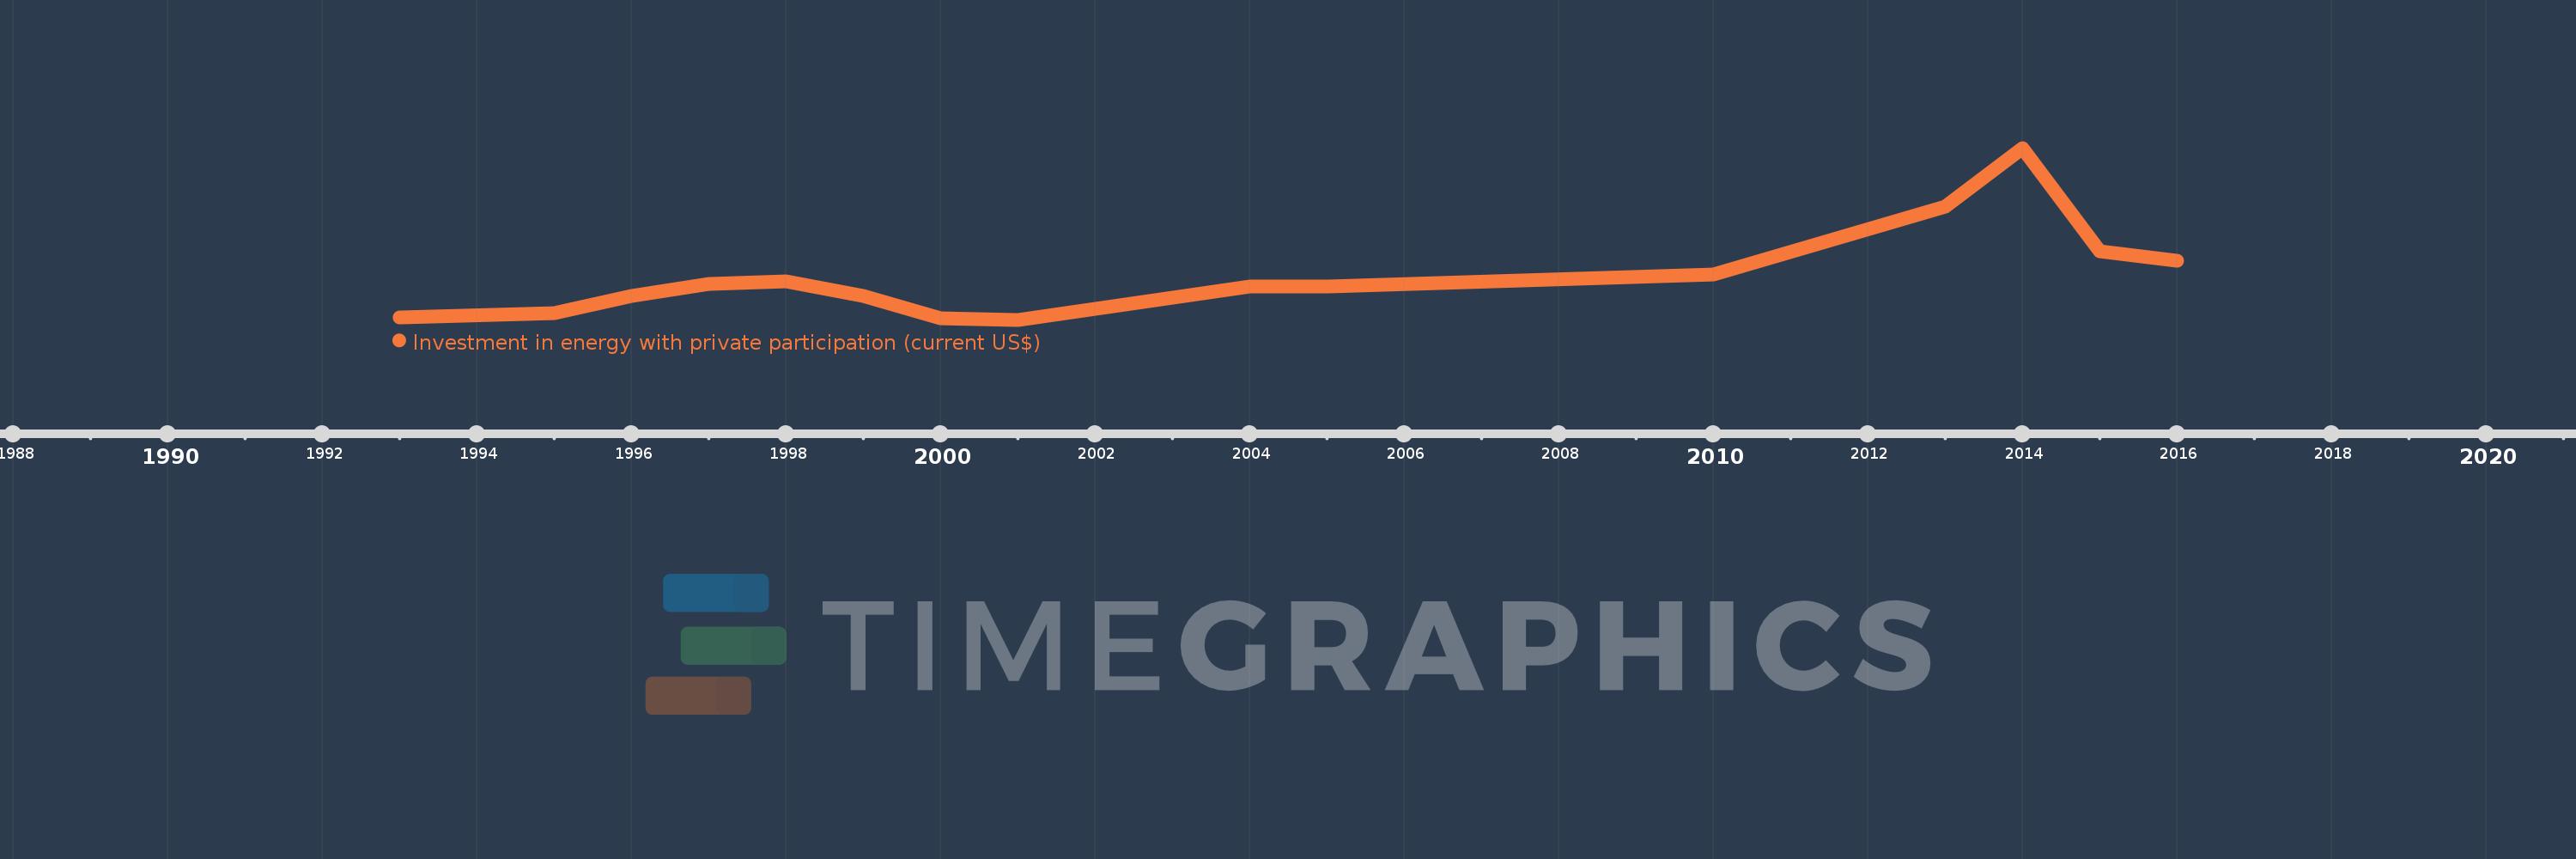
Questa scala temporale mostra un grafico dal 1993 anno al 2016 anno. Costa Rica. I dati fino ad 1992 anno non disponibili. Il numero di osservazioni attuali secondo i date: 15.
La fonte (nome):
Indicatori dello sviluppo mondiale
La fonte (organizzazione):
World Bank, Private Participation in Infrastructure Project Database (http://ppi.worldbank.org).
Categorie:
Energy & Mining, Infrastructure, Private Sector
sono stati aggiornati
23 apr 2017 anni
Indicatori delle variazioni dei valori per anni
In media:
105.733 Mln
Minima:
0.0
1 gen 2001 anni
Massimo:
415.6 Mln
1 gen 2014 anni
Alla data di osservazione
Valore
Variazione assoluta
La variazione rispetto al valore precedente
1 gen 1993 anni
5.8 Mln
+5.8 Mln
0.0%
1 gen 1995 anni
15.0 Mln
+9.2 Mln
158.62%
1 gen 1996 anni
58.1 Mln
+43.1 Mln
287.33%
1 gen 1997 anni
85.7 Mln
+27.6 Mln
47.5%
1 gen 1998 anni
92.9 Mln
+7.2 Mln
8.4%
1 gen 1999 anni
58.5 Mln
-34.4 Mln
-37.03%
1 gen 2000 anni
3.4 Mln
-55.1 Mln
-94.19%
1 gen 2001 anni
0.0
-3.4 Mln
-100.0%
1 gen 2004 anni
80.0 Mln
+80.0 Mln
%
1 gen 2005 anni
80.0 Mln
0.0
0.0%
1 gen 2010 anni
110.0 Mln
+30.0 Mln
37.5%
1 gen 2013 anni
273.0 Mln
+163.0 Mln
148.18%
1 gen 2014 anni
415.6 Mln
+142.6 Mln
52.23%
1 gen 2015 anni
165.0 Mln
-250.6 Mln
-60.3%
1 gen 2016 anni
143.0 Mln
-22.0 Mln
-13.33%
Classificazione dei paesi secondo i statistiche attuali per anni