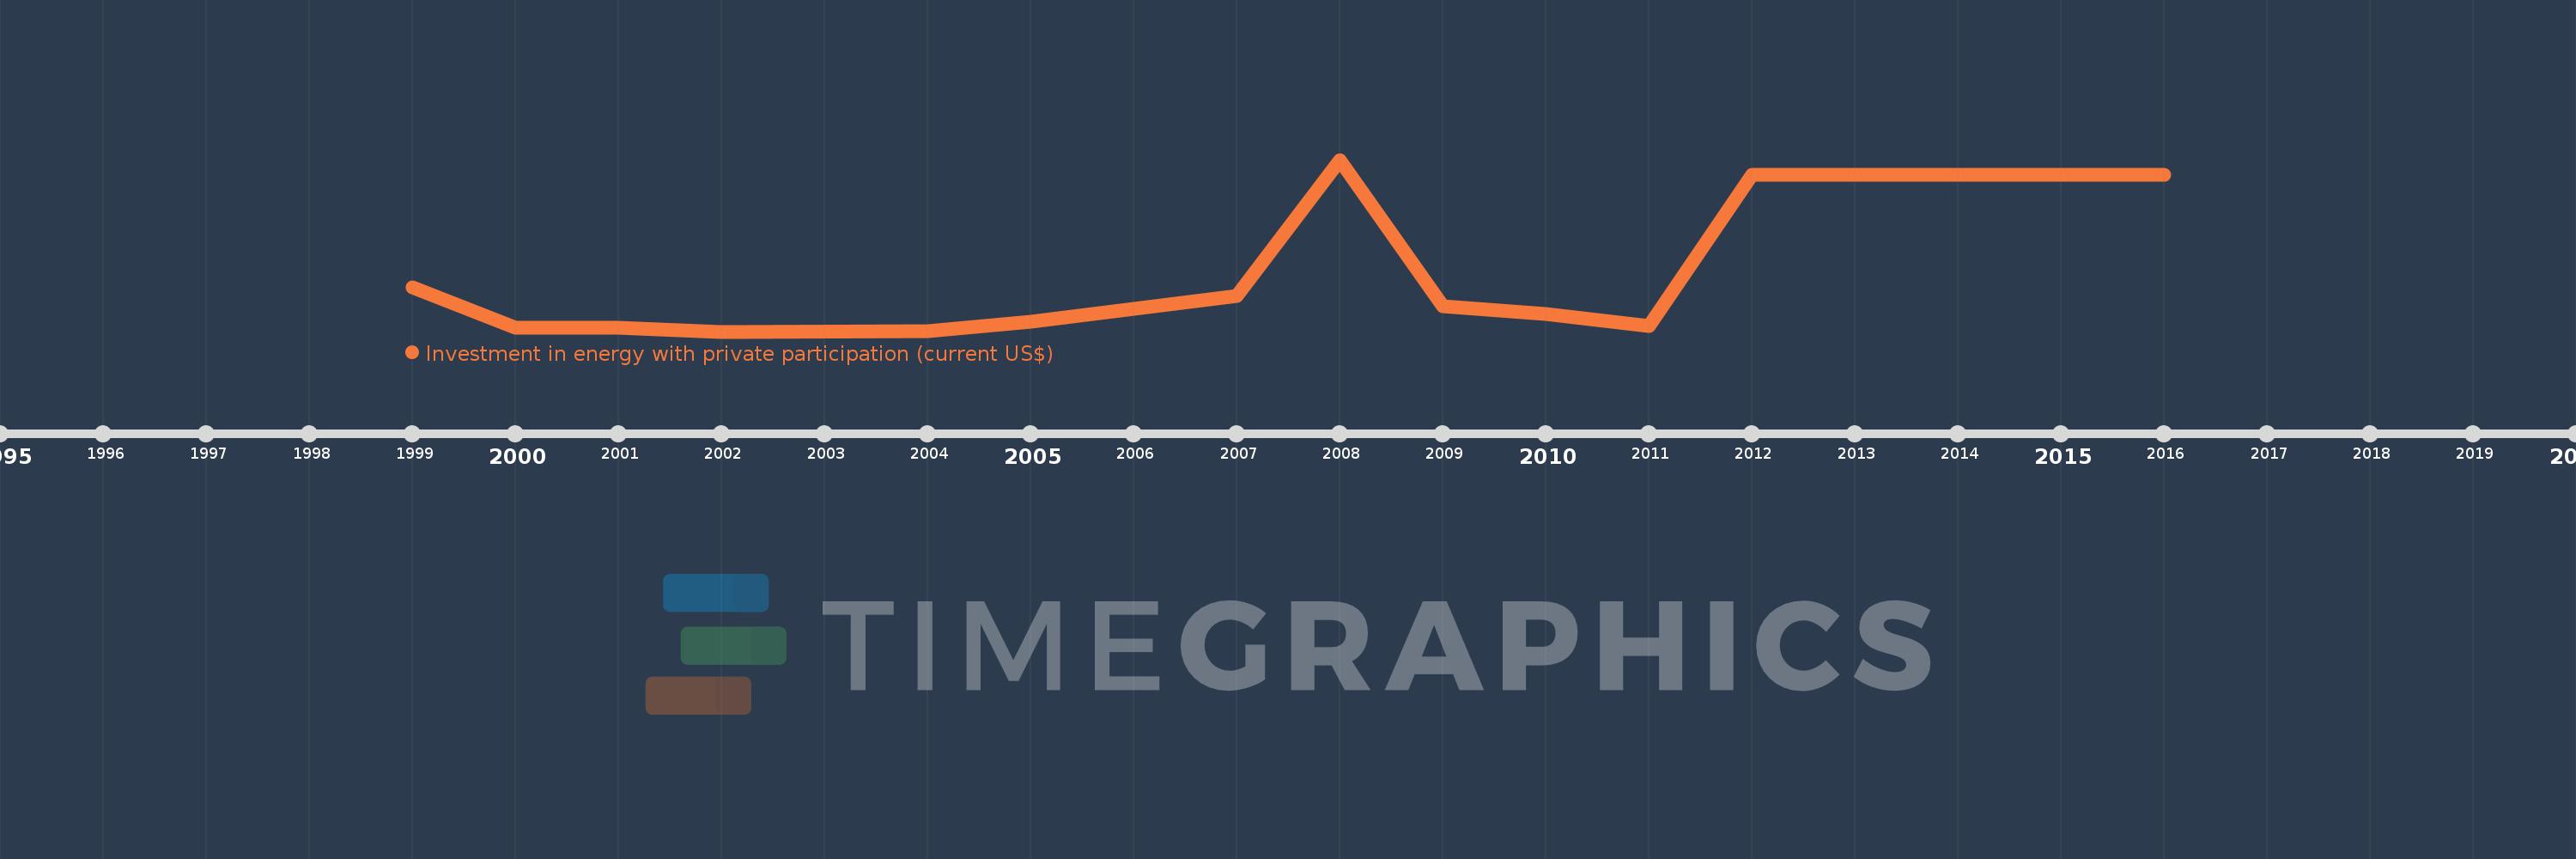
Questa scala temporale mostra un grafico dal 1999 anno al 2016 anno. Georgia. I dati fino ad 1998 anno non disponibili. Il numero di osservazioni attuali secondo i date: 13.
La fonte (nome):
Indicatori dello sviluppo mondiale
La fonte (organizzazione):
World Bank, Private Participation in Infrastructure Project Database (http://ppi.worldbank.org).
Categorie:
Energy & Mining, Infrastructure, Private Sector
sono stati aggiornati
23 apr 2017 anni
Indicatori delle variazioni dei valori per anni
In media:
129.723 Mln
Minima:
0.0
1 gen 2002 anni
Massimo:
457.7 Mln
1 gen 2008 anni
Alla data di osservazione
Valore
Variazione assoluta
La variazione rispetto al valore precedente
1 gen 1999 anni
119.0 Mln
+119.0 Mln
0.0%
1 gen 2000 anni
10.0 Mln
-109.0 Mln
-91.6%
1 gen 2001 anni
11.0 Mln
+1000.0 Mille.
10.0%
1 gen 2002 anni
0.0
-11.0 Mln
-100.0%
1 gen 2004 anni
2.0 Mln
+2.0 Mln
%
1 gen 2005 anni
27.0 Mln
+25.0 Mln
1.25 Mille.%
1 gen 2007 anni
94.5 Mln
+67.5 Mln
250.0%
1 gen 2008 anni
457.7 Mln
+363.2 Mln
384.34%
1 gen 2009 anni
67.8 Mln
-389.9 Mln
-85.19%
1 gen 2010 anni
47.7 Mln
-20.1 Mln
-29.65%
1 gen 2011 anni
15.7 Mln
-32.0 Mln
-67.09%
1 gen 2012 anni
417.0 Mln
+401.3 Mln
2.56 Mille.%
1 gen 2016 anni
417.0 Mln
0.0
0.0%
Classificazione dei paesi secondo i statistiche attuali per anni