Download Queste statistiche in altri paesi:
Linea del tempo:
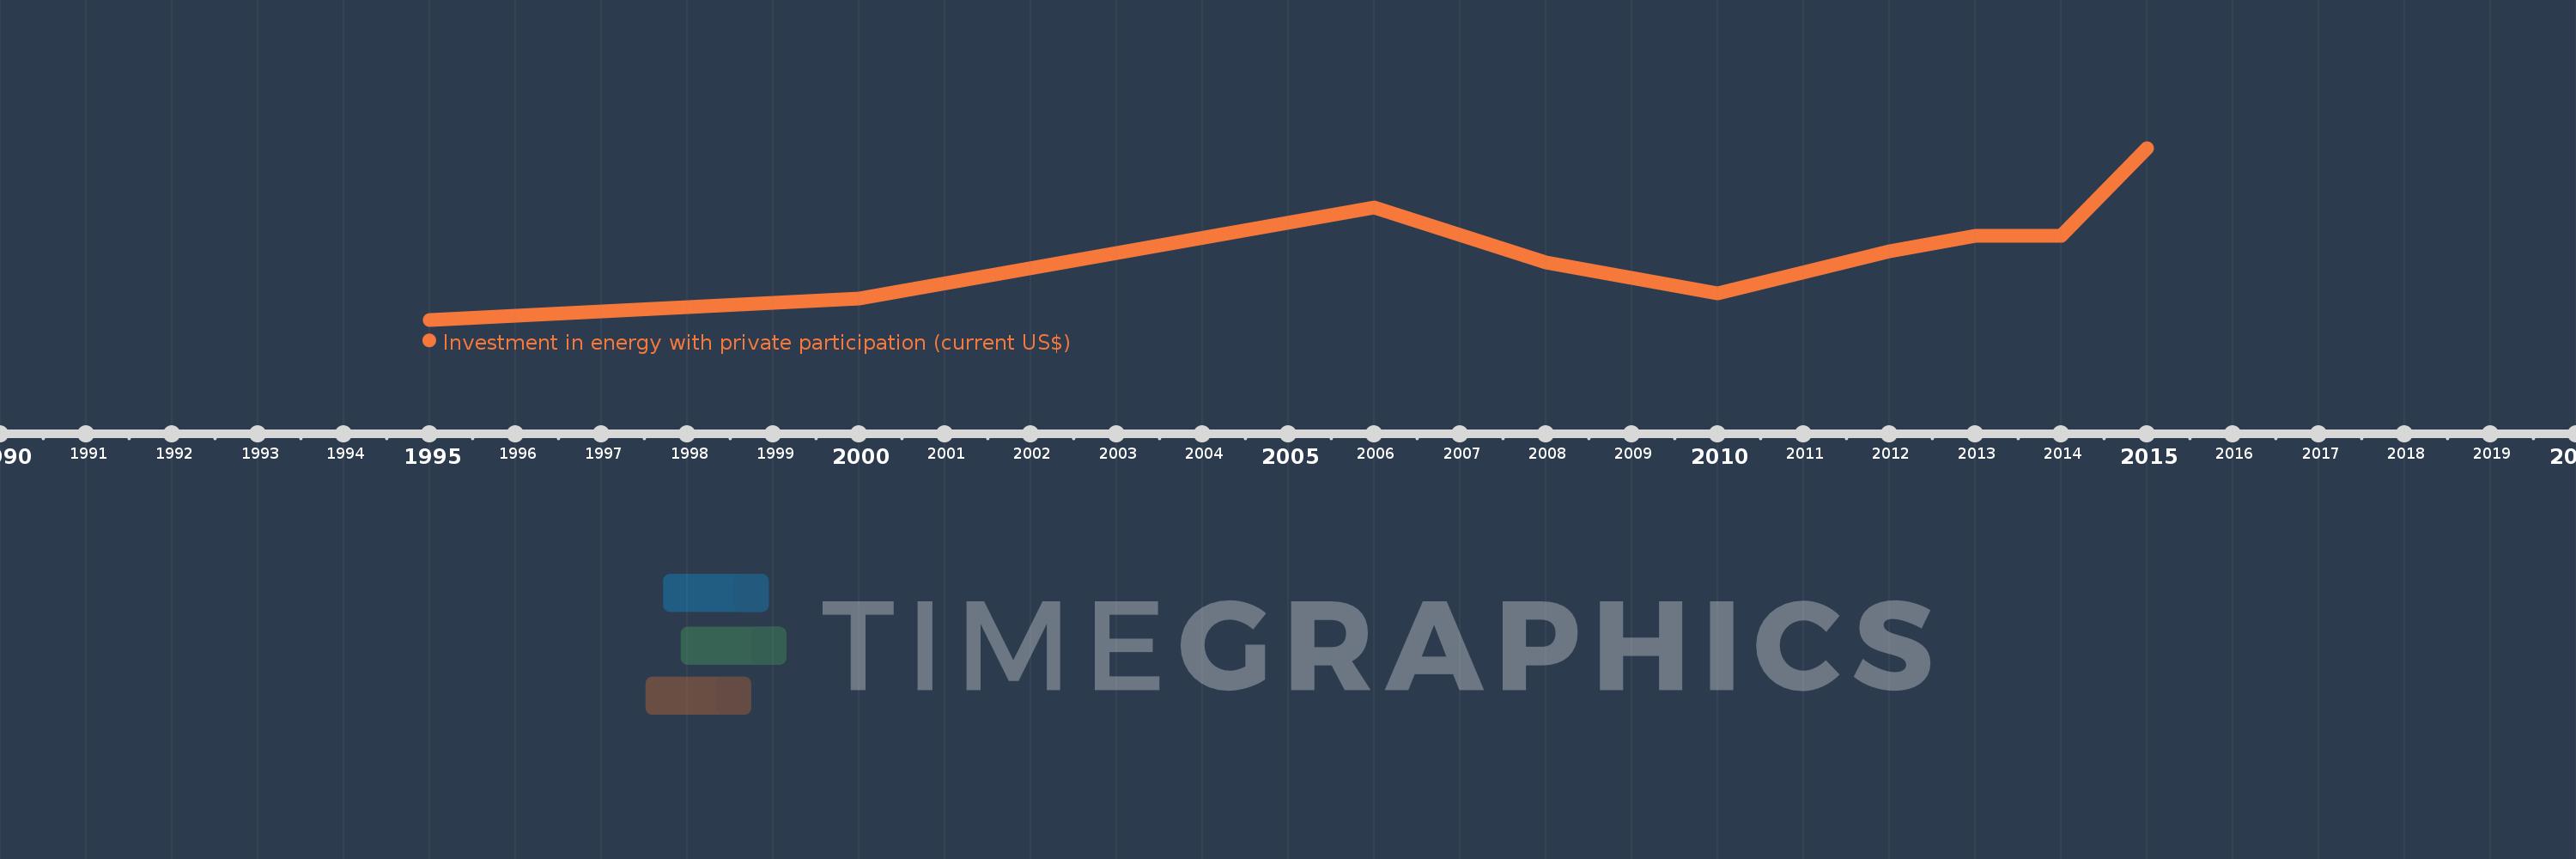
Questa scala temporale mostra un grafico dal 1995 anno al 2015 anno. Ghana. I dati fino ad 1994 anno non disponibili. Il numero di osservazioni attuali secondo i date: 9.
La fonte (nome):
Indicatori dello sviluppo mondiale
La fonte (organizzazione):
World Bank, Private Participation in Infrastructure Project Database (http://ppi.worldbank.org).
Categorie:
Energy & Mining, Infrastructure, Private Sector
sono stati aggiornati
23 apr 2017 anni
Indicatori delle variazioni dei valori per anni
Minima:
0.0
1 gen 1995 anni
Massimo:
900.0 Mln
1 gen 2015 anni
Alla data di osservazione
Valore
Variazione assoluta
La variazione rispetto al valore precedente
1 gen 1995 anni
0.0
0.0
0.0%
1 gen 2000 anni
110.0 Mln
+110.0 Mln
%
1 gen 2006 anni
590.0 Mln
+480.0 Mln
436.36%
1 gen 2008 anni
300.0 Mln
-290.0 Mln
-49.15%
1 gen 2010 anni
140.0 Mln
-160.0 Mln
-53.33%
1 gen 2012 anni
360.0 Mln
+220.0 Mln
157.14%
1 gen 2013 anni
440.0 Mln
+80.0 Mln
22.22%
1 gen 2014 anni
440.0 Mln
0.0
0.0%
1 gen 2015 anni
900.0 Mln
+460.0 Mln
104.55%
Classificazione dei paesi secondo i statistiche attuali per anni