Download Queste statistiche in altri paesi:
Linea del tempo:
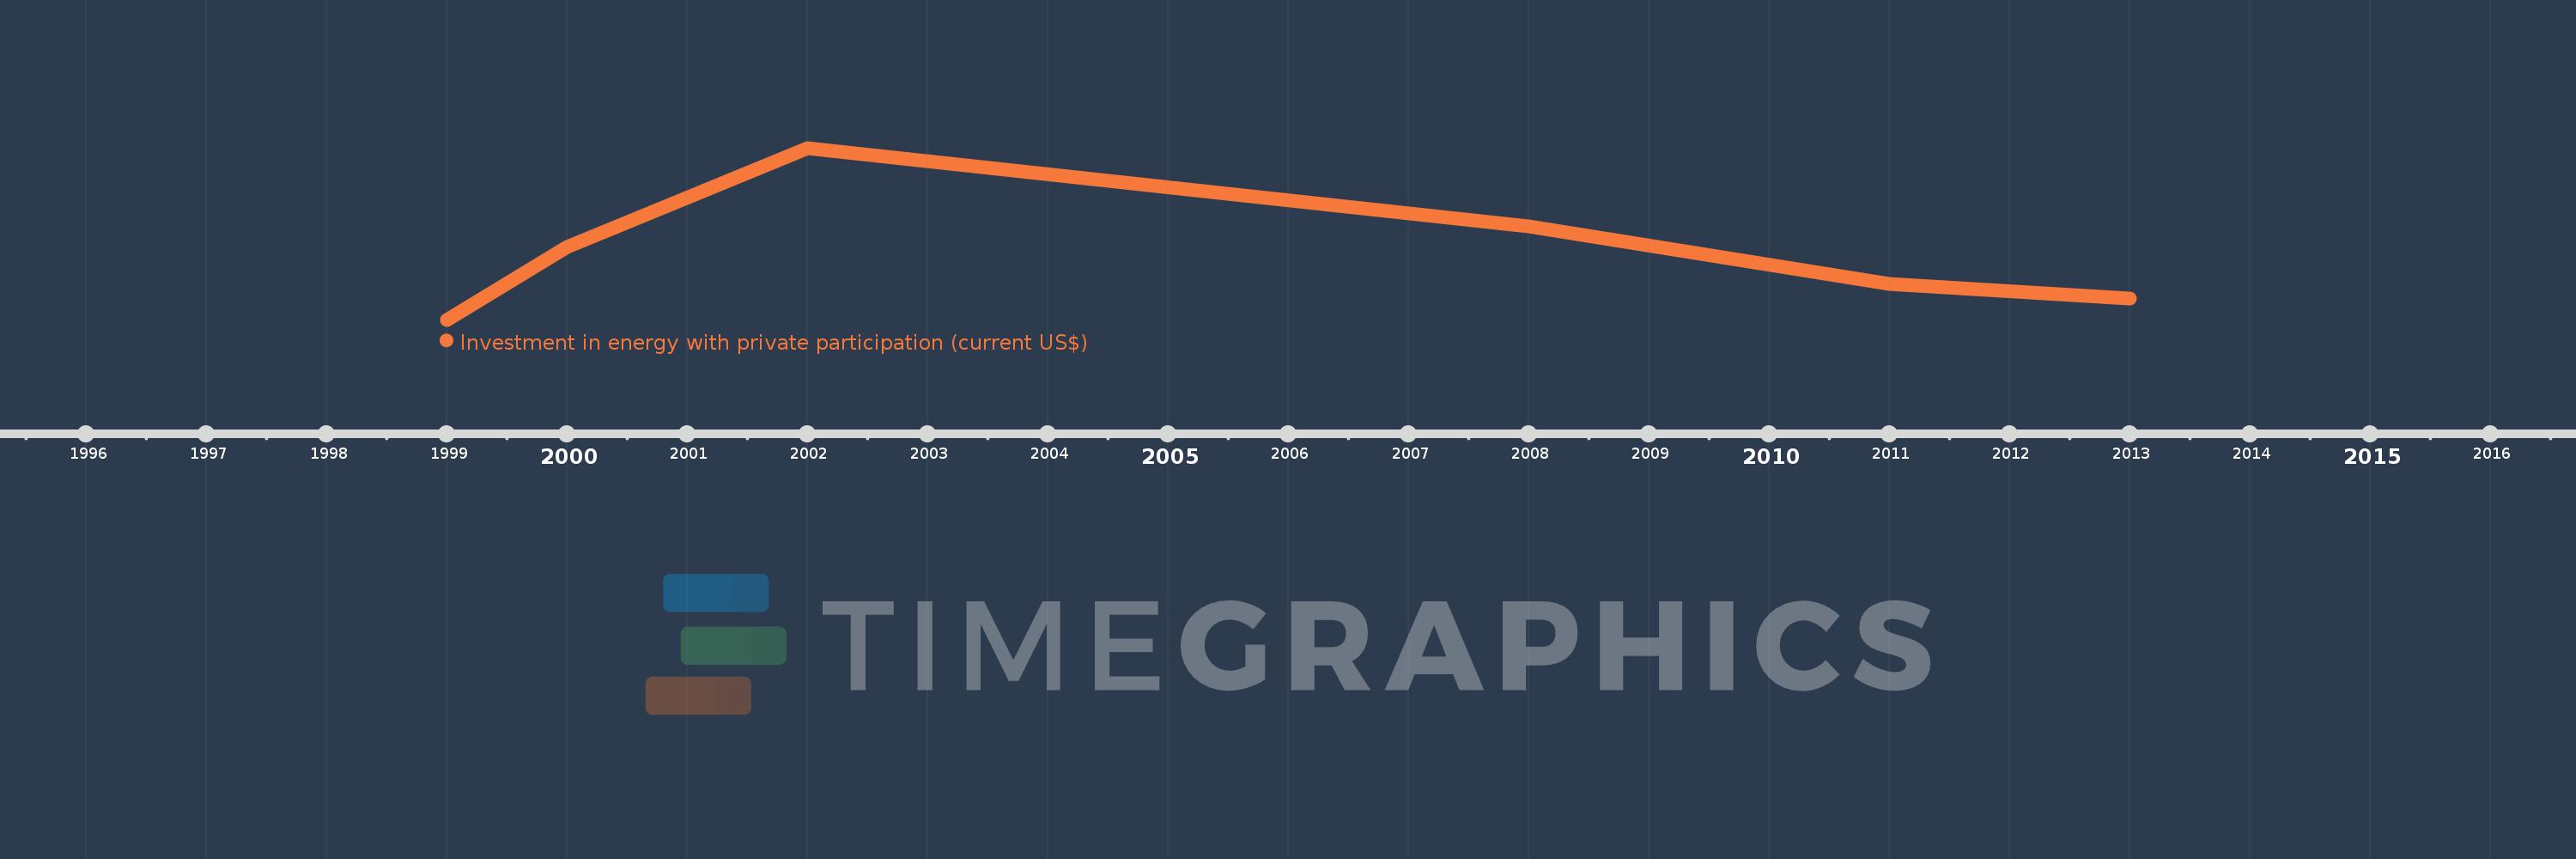
Questa scala temporale mostra un grafico dal 1999 anno al 2013 anno. Egypt, Arab Rep.. I dati fino ad 1998 anno non disponibili. Il numero di osservazioni attuali secondo i date: 6.
La fonte (nome):
Indicatori dello sviluppo mondiale
La fonte (organizzazione):
World Bank, Private Participation in Infrastructure Project Database (http://ppi.worldbank.org).
Categorie:
Energy & Mining, Infrastructure, Private Sector
sono stati aggiornati
23 apr 2017 anni
Indicatori delle variazioni dei valori per anni
Minima:
220.0 Mln
1 gen 1999 anni
Massimo:
678.0 Mln
1 gen 2002 anni
Alla data di osservazione
Valore
Variazione assoluta
La variazione rispetto al valore precedente
1 gen 1999 anni
220.0 Mln
+220.0 Mln
0.0%
1 gen 2000 anni
414.0 Mln
+194.0 Mln
88.18%
1 gen 2002 anni
678.0 Mln
+264.0 Mln
63.77%
1 gen 2008 anni
469.0 Mln
-209.0 Mln
-30.83%
1 gen 2011 anni
314.7 Mln
-154.3 Mln
-32.9%
1 gen 2013 anni
276.0 Mln
-38.7 Mln
-12.3%
Classificazione dei paesi secondo i statistiche attuali per anni