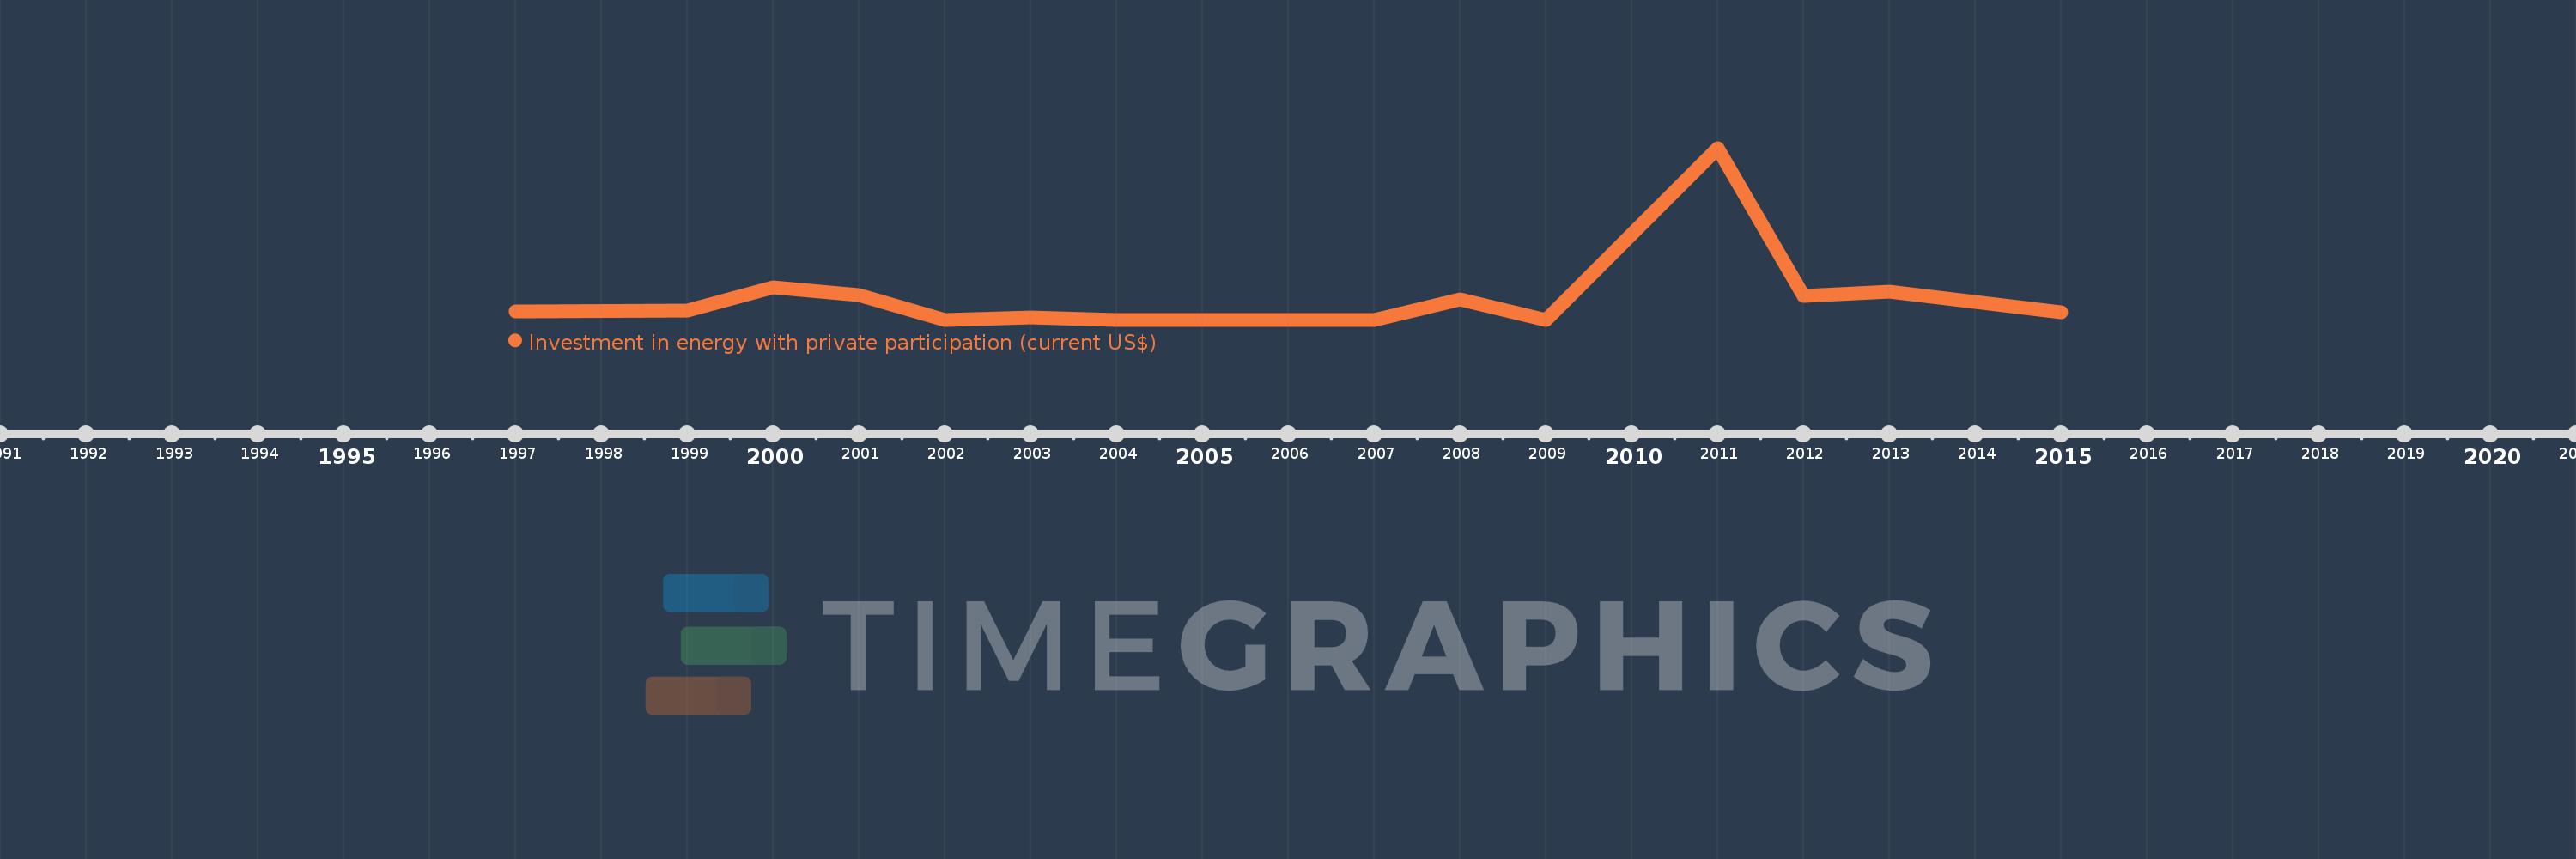
Questa scala temporale mostra un grafico dal 1997 anno al 2015 anno. Nicaragua. I dati fino ad 1996 anno non disponibili. Il numero di osservazioni attuali secondo i date: 16.
La fonte (nome):
Indicatori dello sviluppo mondiale
La fonte (organizzazione):
World Bank, Private Participation in Infrastructure Project Database (http://ppi.worldbank.org).
Categorie:
Energy & Mining, Infrastructure, Private Sector
sono stati aggiornati
23 apr 2017 anni
Indicatori delle variazioni dei valori per anni
In media:
95.106 Mln
Minima:
0.0
1 gen 2002 anni
Massimo:
795.0 Mln
1 gen 2011 anni
Alla data di osservazione
Valore
Variazione assoluta
La variazione rispetto al valore precedente
1 gen 1997 anni
38.0 Mln
+38.0 Mln
0.0%
1 gen 1999 anni
43.0 Mln
+5.0 Mln
13.16%
1 gen 2000 anni
151.4 Mln
+108.4 Mln
252.09%
1 gen 2001 anni
115.0 Mln
-36.4 Mln
-24.04%
1 gen 2002 anni
0.0
-115.0 Mln
-100.0%
1 gen 2003 anni
11.3 Mln
+11.3 Mln
%
1 gen 2004 anni
0.0
-11.3 Mln
-100.0%
1 gen 2005 anni
0.0
0.0
%
1 gen 2006 anni
0.0
0.0
%
1 gen 2007 anni
0.0
0.0
%
1 gen 2008 anni
95.0 Mln
+95.0 Mln
%
1 gen 2009 anni
0.0
-95.0 Mln
-100.0%
1 gen 2011 anni
795.0 Mln
+795.0 Mln
%
1 gen 2012 anni
110.0 Mln
-685.0 Mln
-86.16%
1 gen 2013 anni
130.0 Mln
+20.0 Mln
18.18%
1 gen 2015 anni
33.0 Mln
-97.0 Mln
-74.62%
Classificazione dei paesi secondo i statistiche attuali per anni