29
/
en
AIzaSyAYiBZKx7MnpbEhh9jyipgxe19OcubqV5w
April 1, 2024
96185
Burundi
BDI
true
2
1
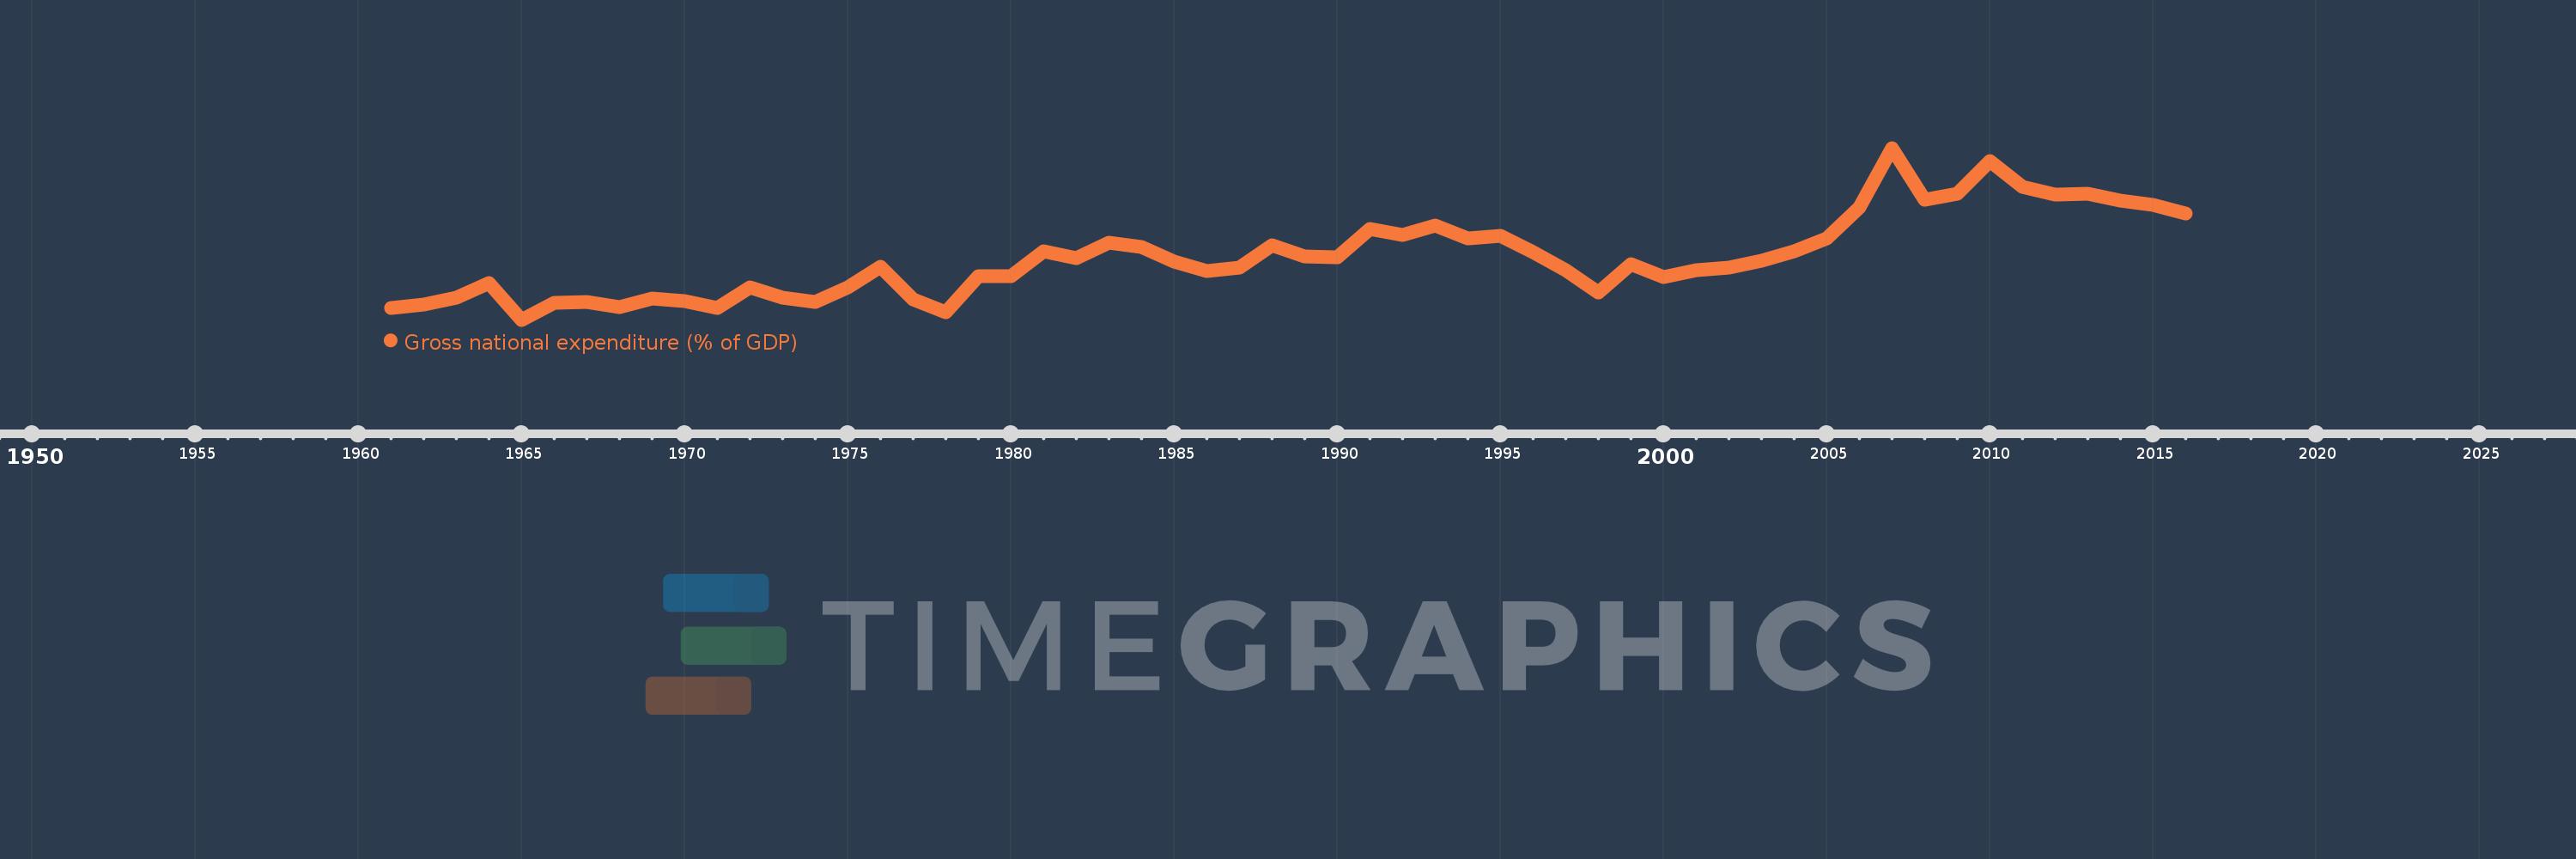
Gross national expenditure (% of GDP)
2016,2015,2014,2013,2012,2011,2010,2009,2008,2007,2006,2005,2004,2003,2002,2001,2000,1999,1998,1997,1996,1995,1994,1993,1992,1991,1990,1989,1988,1987,1986,1985,1984,1983,1982,1981,1980,1979,1978,1977,1976,1975,1974,1973,1972,1971,1970,1969,1968,1967,1966,1965,1964,1963,1962,1961
This statistics in other country:
AfghanistanAlbaniaAlgeriaAngolaAntigua and BarbudaArgentinaArmeniaArubaAustraliaAustriaAzerbaijanBahamas, TheBahrainBangladeshBarbadosBelarusBelgiumBelizeBeninBermudaBhutanBoliviaBosnia and HerzegovinaBotswanaBrazilBrunei DarussalamBulgariaBurkina FasoBurundiCabo VerdeCambodiaCameroonCanadaCentral African RepublicChadChileChinaColombiaComorosCongo, Dem. Rep.Congo, Rep.Costa RicaCote d'IvoireCroatiaCubaCyprusCzech RepublicDenmarkDjiboutiDominicaDominican RepublicEcuadorEgypt, Arab Rep.El SalvadorEquatorial GuineaEritreaEstoniaEthiopiaFaroe IslandsFijiFinlandFranceGabonGambia, TheGeorgiaGermanyGhanaGreeceGrenadaGuatemalaGuineaGuinea-BissauGuyanaHaitiHondurasHong Kong SAR, ChinaHungaryIcelandIndiaIndonesiaIran, Islamic Rep.IraqIrelandIsraelItalyJamaicaJapanJordanKazakhstanKenyaKiribatiKorea, Rep.KosovoKuwaitKyrgyz RepublicLao PDRLatviaLebanonLesothoLiberiaLibyaLithuaniaLuxembourgMacao SAR, ChinaMacedonia, FYRMadagascarMalawiMalaysiaMaldivesMaliMaltaMauritaniaMauritiusMexicoMicronesia, Fed. Sts.MoldovaMongoliaMontenegroMoroccoMozambiqueNamibiaNepalNetherlandsNew CaledoniaNew ZealandNicaraguaNigerNigeriaNorwayOmanPakistanPanamaPapua New GuineaParaguayPeruPhilippinesPolandPortugalPuerto RicoQatarRomaniaRussian FederationRwandaSaudi ArabiaSenegalSerbiaSeychellesSierra LeoneSingaporeSlovak RepublicSloveniaSolomon IslandsSomaliaSouth AfricaSouth SudanSpainSri LankaSt. Kitts and NevisSt. LuciaSt. Vincent and the GrenadinesSudanSurinameSwazilandSwedenSwitzerlandSyrian Arab RepublicTajikistanTanzaniaThailandTimor-LesteTogoTongaTrinidad and TobagoTunisiaTurkeyTurkmenistanUgandaUkraineUnited Arab EmiratesUnited KingdomUnited StatesUruguayUzbekistanVanuatuVenezuela, RBVietnamWest Bank and GazaYemen, Rep.ZambiaZimbabwe Timeline:
This timeline shows a graph from 1961 to 2016 of Burundi. No data until 1960. Number of actual observations by date: 56.
Source name:
World Development Indicators
Source organization:
World Bank national accounts data, and OECD National Accounts data files.
Categories, topics:
Economy & Growth
Last updated:
apr 23, 2017
Indicators value changes by year
Minimum:
97.987
jan 1, 1965
Maximum:
139.588
jan 1, 2007
At the date of observation
Value
Absolute change
Change from previous value
jan 1, 1961
100.893
+100.893
0.0%
jan 1, 1962
101.724
+0.831
0.82%
jan 1, 1963
103.279
+1.555
1.53%
jan 1, 1964
106.767
+3.488
3.38%
jan 1, 1965
97.987
-8.78
-8.22%
jan 1, 1966
102.186
+4.2
4.29%
jan 1, 1967
102.216
+0.03
0.03%
jan 1, 1968
101.085
-1.131
-1.11%
jan 1, 1969
103.071
+1.986
1.96%
jan 1, 1970
102.436
-0.635
-0.62%
jan 1, 1971
100.932
-1.504
-1.47%
jan 1, 1972
105.736
+4.804
4.76%
jan 1, 1973
103.341
-2.395
-2.27%
jan 1, 1974
102.317
-1.024
-0.99%
jan 1, 1975
105.781
+3.464
3.39%
jan 1, 1976
110.726
+4.946
4.68%
jan 1, 1977
102.926
-7.8
-7.04%
jan 1, 1978
99.696
-3.231
-3.14%
jan 1, 1979
108.519
+8.823
8.85%
jan 1, 1980
108.559
+0.041
0.04%
jan 1, 1981
114.483
+5.923
5.46%
jan 1, 1982
112.894
-1.588
-1.39%
jan 1, 1983
116.695
+3.801
3.37%
jan 1, 1984
115.702
-0.993
-0.85%
jan 1, 1985
112.048
-3.654
-3.16%
jan 1, 1986
109.76
-2.288
-2.04%
jan 1, 1987
110.592
+0.832
0.76%
jan 1, 1988
115.994
+5.401
4.88%
jan 1, 1989
113.362
-2.631
-2.27%
jan 1, 1990
113.198
-0.165
-0.15%
jan 1, 1991
119.902
+6.704
5.92%
jan 1, 1992
118.588
-1.314
-1.1%
jan 1, 1993
120.728
+2.14
1.8%
jan 1, 1994
117.779
-2.949
-2.44%
jan 1, 1995
118.21
+0.431
0.37%
jan 1, 1996
114.352
-3.858
-3.26%
jan 1, 1997
109.933
-4.419
-3.86%
jan 1, 1998
104.604
-5.329
-4.85%
jan 1, 1999
111.441
+6.836
6.54%
jan 1, 2000
108.388
-3.052
-2.74%
jan 1, 2001
109.916
+1.528
1.41%
jan 1, 2002
110.606
+0.69
0.63%
jan 1, 2003
112.302
+1.697
1.53%
jan 1, 2004
114.613
+2.311
2.06%
jan 1, 2005
117.671
+3.057
2.67%
jan 1, 2006
125.242
+7.571
6.43%
jan 1, 2007
139.588
+14.346
11.45%
jan 1, 2008
126.965
-12.622
-9.04%
jan 1, 2009
128.434
+1.469
1.16%
jan 1, 2010
136.321
+7.887
6.14%
jan 1, 2011
130.262
-6.059
-4.44%
jan 1, 2012
128.312
-1.951
-1.5%
jan 1, 2013
128.519
+0.207
0.16%
jan 1, 2014
126.85
-1.669
-1.3%
jan 1, 2015
125.771
-1.079
-0.85%
jan 1, 2016
123.676
-2.094
-1.67%
Ranking of countries by current statistics by years


Comments: