29
/
en
AIzaSyAYiBZKx7MnpbEhh9jyipgxe19OcubqV5w
April 1, 2024
205336
Namibia
NAM
true
2
1
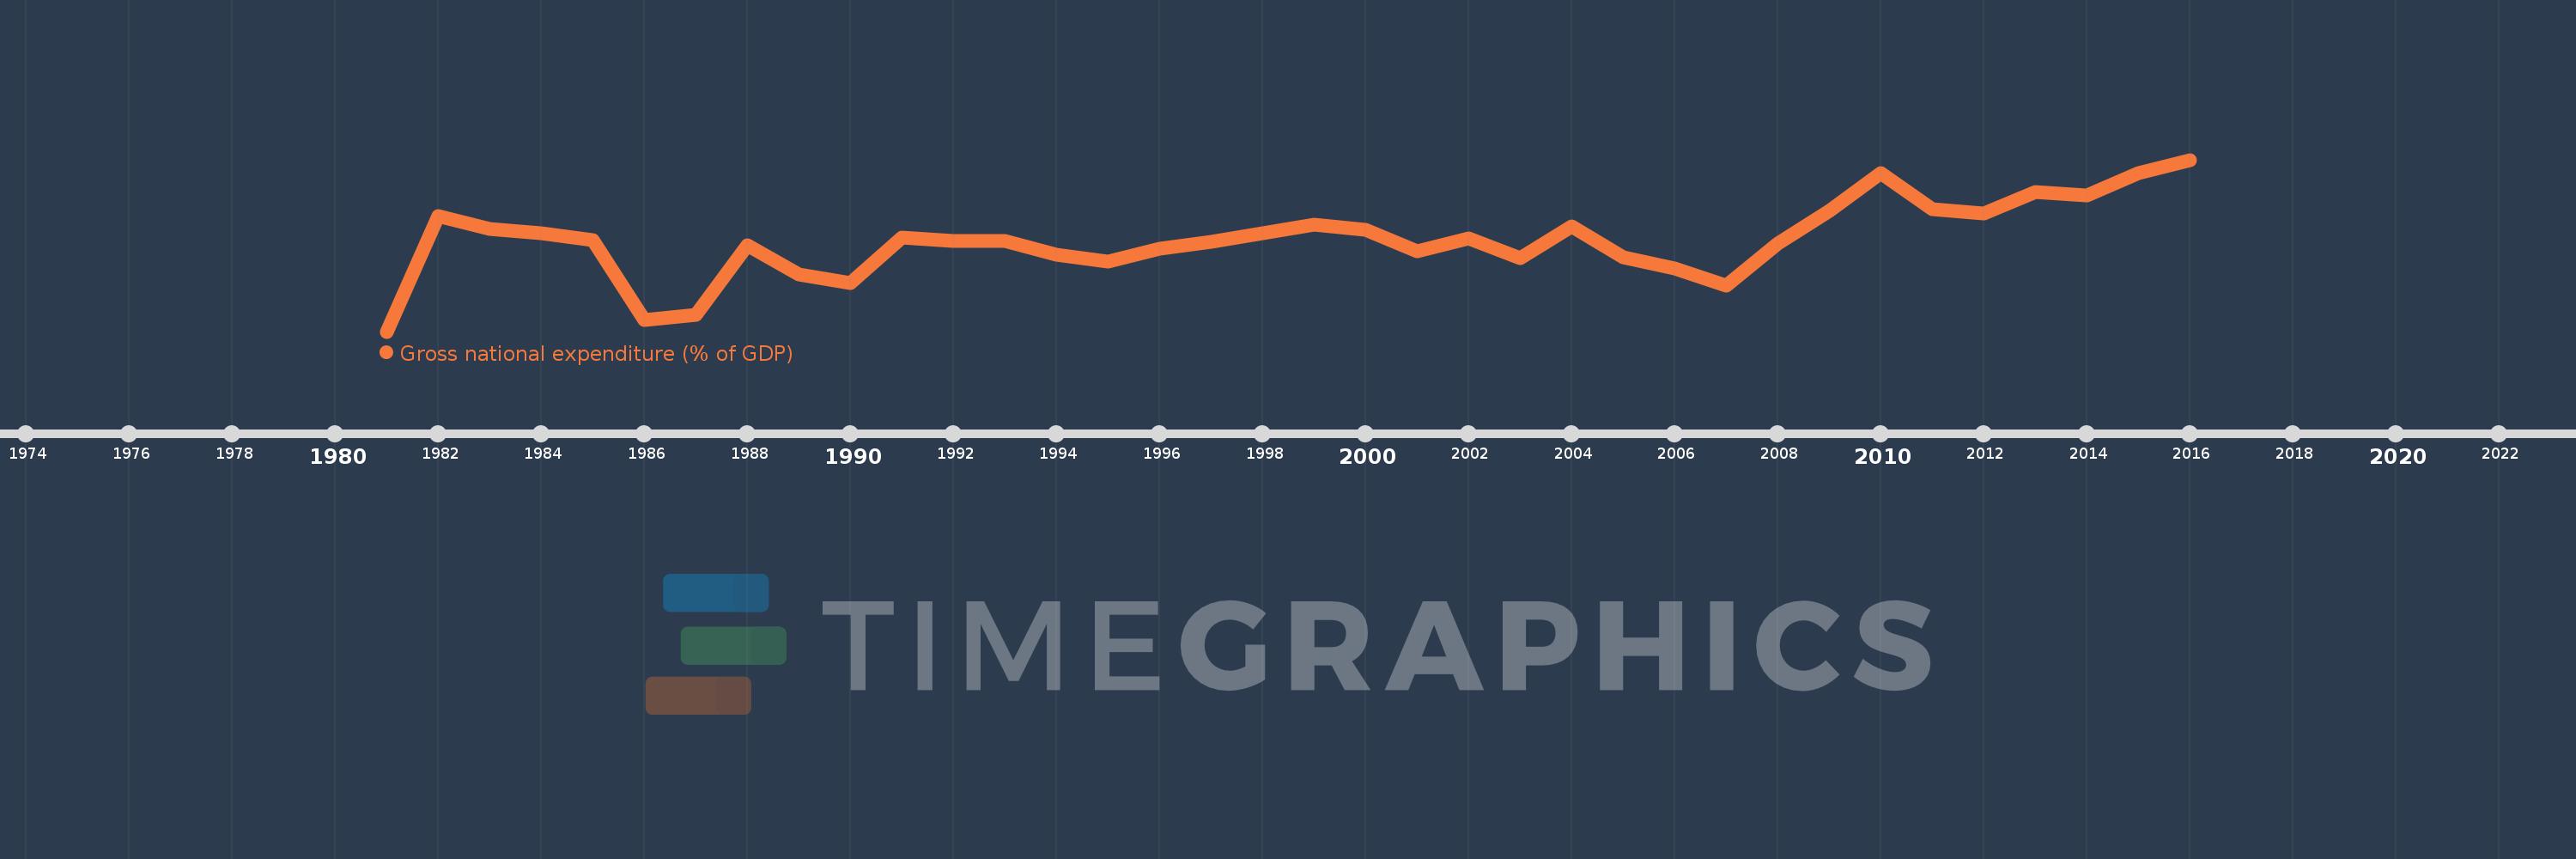
Gross national expenditure (% of GDP)
2016,2015,2014,2013,2012,2011,2010,2009,2008,2007,2006,2005,2004,2003,2002,2001,2000,1999,1998,1997,1996,1995,1994,1993,1992,1991,1990,1989,1988,1987,1986,1985,1984,1983,1982,1981
This statistics in other country:
AfghanistanAlbaniaAlgeriaAngolaAntigua and BarbudaArgentinaArmeniaArubaAustraliaAustriaAzerbaijanBahamas, TheBahrainBangladeshBarbadosBelarusBelgiumBelizeBeninBermudaBhutanBoliviaBosnia and HerzegovinaBotswanaBrazilBrunei DarussalamBulgariaBurkina FasoBurundiCabo VerdeCambodiaCameroonCanadaCentral African RepublicChadChileChinaColombiaComorosCongo, Dem. Rep.Congo, Rep.Costa RicaCote d'IvoireCroatiaCubaCyprusCzech RepublicDenmarkDjiboutiDominicaDominican RepublicEcuadorEgypt, Arab Rep.El SalvadorEquatorial GuineaEritreaEstoniaEthiopiaFaroe IslandsFijiFinlandFranceGabonGambia, TheGeorgiaGermanyGhanaGreeceGrenadaGuatemalaGuineaGuinea-BissauGuyanaHaitiHondurasHong Kong SAR, ChinaHungaryIcelandIndiaIndonesiaIran, Islamic Rep.IraqIrelandIsraelItalyJamaicaJapanJordanKazakhstanKenyaKiribatiKorea, Rep.KosovoKuwaitKyrgyz RepublicLao PDRLatviaLebanonLesothoLiberiaLibyaLithuaniaLuxembourgMacao SAR, ChinaMacedonia, FYRMadagascarMalawiMalaysiaMaldivesMaliMaltaMauritaniaMauritiusMexicoMicronesia, Fed. Sts.MoldovaMongoliaMontenegroMoroccoMozambiqueNamibiaNepalNetherlandsNew CaledoniaNew ZealandNicaraguaNigerNigeriaNorwayOmanPakistanPanamaPapua New GuineaParaguayPeruPhilippinesPolandPortugalPuerto RicoQatarRomaniaRussian FederationRwandaSaudi ArabiaSenegalSerbiaSeychellesSierra LeoneSingaporeSlovak RepublicSloveniaSolomon IslandsSomaliaSouth AfricaSouth SudanSpainSri LankaSt. Kitts and NevisSt. LuciaSt. Vincent and the GrenadinesSudanSurinameSwazilandSwedenSwitzerlandSyrian Arab RepublicTajikistanTanzaniaThailandTimor-LesteTogoTongaTrinidad and TobagoTunisiaTurkeyTurkmenistanUgandaUkraineUnited Arab EmiratesUnited KingdomUnited StatesUruguayUzbekistanVanuatuVenezuela, RBVietnamWest Bank and GazaYemen, Rep.ZambiaZimbabwe Timeline:
This timeline shows a graph from 1981 to 2016 of Namibia. No data until 1980. Number of actual observations by date: 36.
Source name:
World Development Indicators
Source organization:
World Bank national accounts data, and OECD National Accounts data files.
Categories, topics:
Economy & Growth
Last updated:
apr 23, 2017
Indicators value changes by year
Minimum:
85.961
jan 1, 1981
Maximum:
123.805
jan 1, 2016
At the date of observation
Value
Absolute change
Change from previous value
jan 1, 1981
85.961
+85.961
0.0%
jan 1, 1982
111.351
+25.39
29.54%
jan 1, 1983
108.533
-2.818
-2.53%
jan 1, 1984
107.571
-0.962
-0.89%
jan 1, 1985
106.149
-1.423
-1.32%
jan 1, 1986
88.552
-17.596
-16.58%
jan 1, 1987
89.711
+1.158
1.31%
jan 1, 1988
104.886
+15.175
16.92%
jan 1, 1989
98.503
-6.383
-6.09%
jan 1, 1990
96.656
-1.847
-1.88%
jan 1, 1991
106.604
+9.948
10.29%
jan 1, 1992
105.84
-0.765
-0.72%
jan 1, 1993
105.911
+0.072
0.07%
jan 1, 1994
102.918
-2.994
-2.83%
jan 1, 1995
101.293
-1.625
-1.58%
jan 1, 1996
104.222
+2.928
2.89%
jan 1, 1997
105.799
+1.577
1.51%
jan 1, 1998
107.645
+1.847
1.75%
jan 1, 1999
109.505
+1.86
1.73%
jan 1, 2000
108.346
-1.158
-1.06%
jan 1, 2001
103.673
-4.674
-4.31%
jan 1, 2002
106.491
+2.819
2.72%
jan 1, 2003
102.07
-4.422
-4.15%
jan 1, 2004
109.085
+7.015
6.87%
jan 1, 2005
102.267
-6.817
-6.25%
jan 1, 2006
99.863
-2.404
-2.35%
jan 1, 2007
96.092
-3.772
-3.78%
jan 1, 2008
105.335
+9.244
9.62%
jan 1, 2009
112.499
+7.164
6.8%
jan 1, 2010
120.784
+8.285
7.36%
jan 1, 2011
112.899
-7.885
-6.53%
jan 1, 2012
111.949
-0.95
-0.84%
jan 1, 2013
116.743
+4.795
4.28%
jan 1, 2014
115.936
-0.807
-0.69%
jan 1, 2015
120.864
+4.928
4.25%
jan 1, 2016
123.805
+2.941
2.43%
Ranking of countries by current statistics by years


Comments: