29
/
en
AIzaSyAYiBZKx7MnpbEhh9jyipgxe19OcubqV5w
April 1, 2024
101153
Canada
CAN
true
2
1
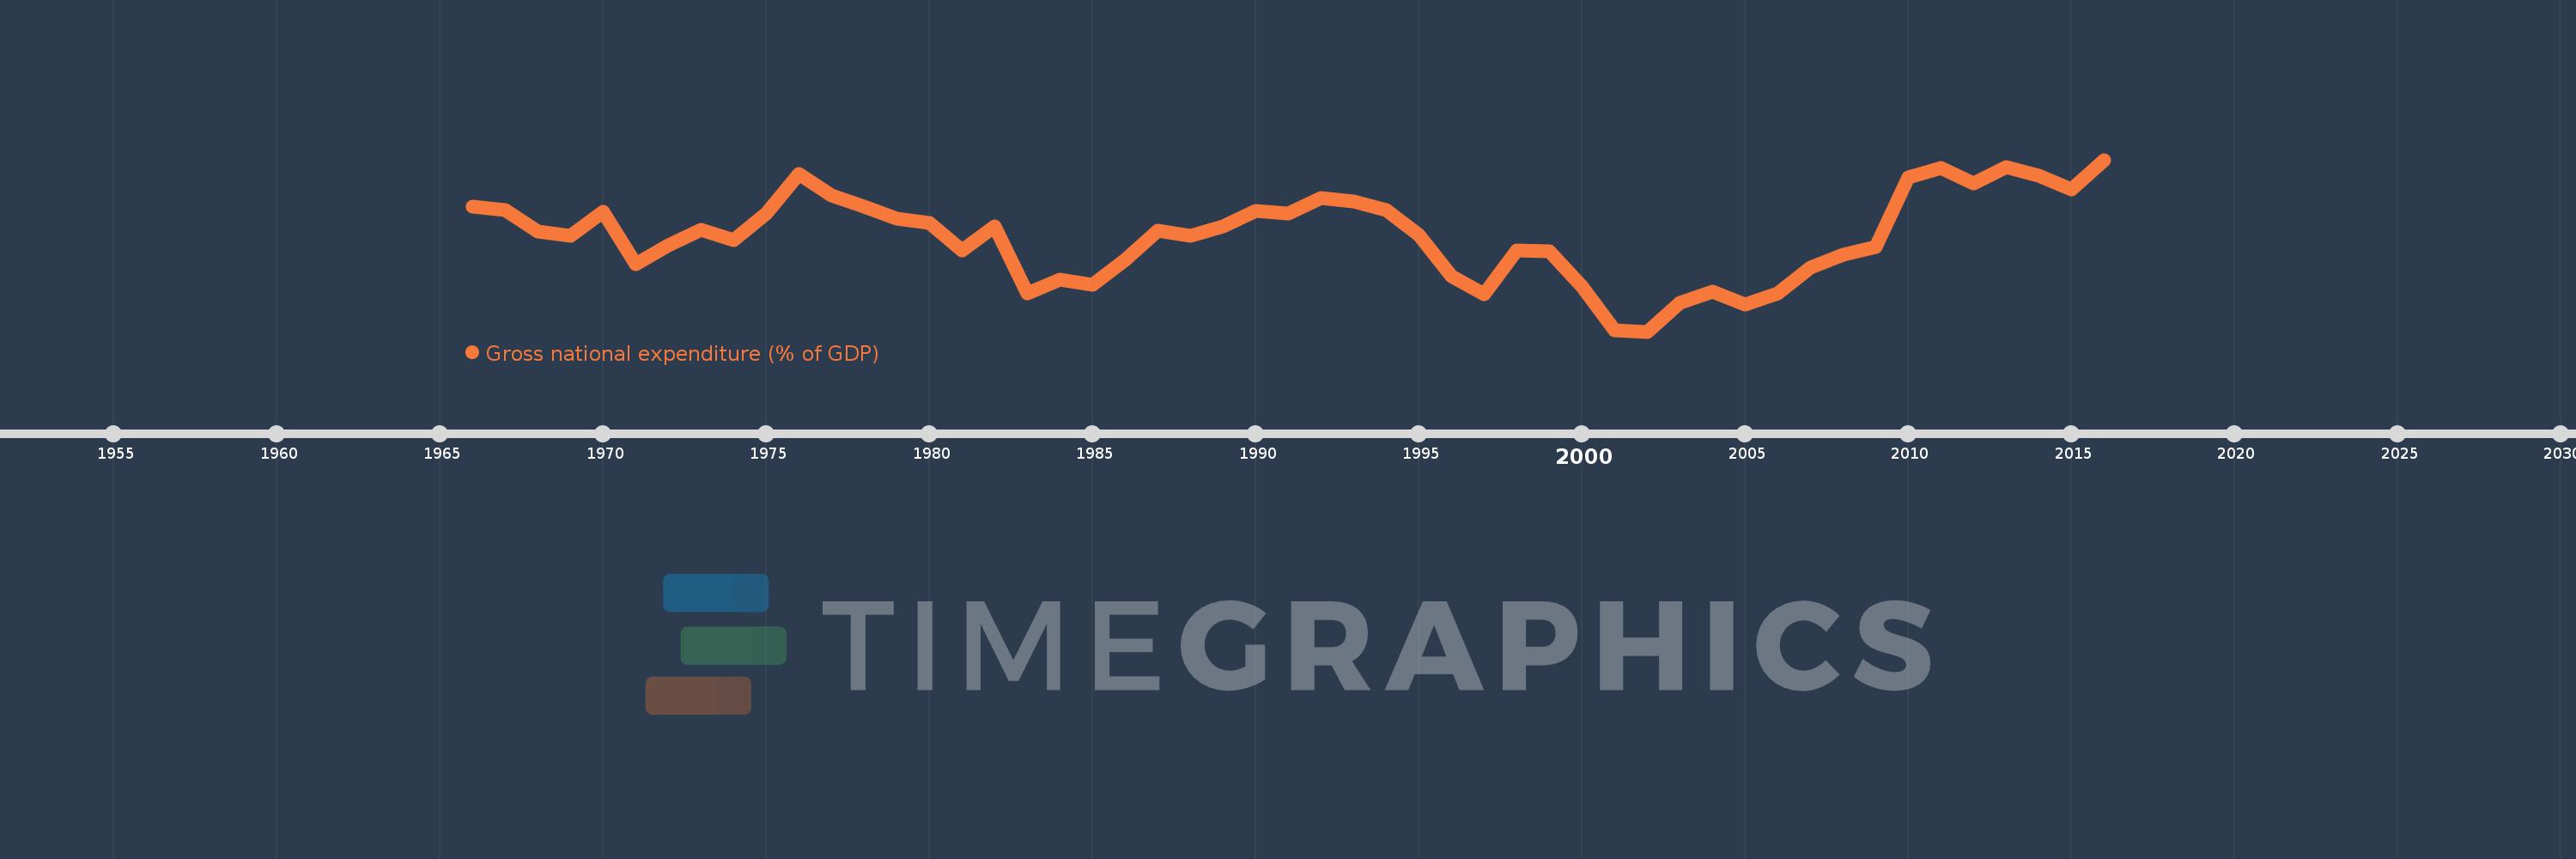
Gross national expenditure (% of GDP)
2016,2015,2014,2013,2012,2011,2010,2009,2008,2007,2006,2005,2004,2003,2002,2001,2000,1999,1998,1997,1996,1995,1994,1993,1992,1991,1990,1989,1988,1987,1986,1985,1984,1983,1982,1981,1980,1979,1978,1977,1976,1975,1974,1973,1972,1971,1970,1969,1968,1967,1966
This statistics in other country:
AfghanistanAlbaniaAlgeriaAngolaAntigua and BarbudaArgentinaArmeniaArubaAustraliaAustriaAzerbaijanBahamas, TheBahrainBangladeshBarbadosBelarusBelgiumBelizeBeninBermudaBhutanBoliviaBosnia and HerzegovinaBotswanaBrazilBrunei DarussalamBulgariaBurkina FasoBurundiCabo VerdeCambodiaCameroonCanadaCentral African RepublicChadChileChinaColombiaComorosCongo, Dem. Rep.Congo, Rep.Costa RicaCote d'IvoireCroatiaCubaCyprusCzech RepublicDenmarkDjiboutiDominicaDominican RepublicEcuadorEgypt, Arab Rep.El SalvadorEquatorial GuineaEritreaEstoniaEthiopiaFaroe IslandsFijiFinlandFranceGabonGambia, TheGeorgiaGermanyGhanaGreeceGrenadaGuatemalaGuineaGuinea-BissauGuyanaHaitiHondurasHong Kong SAR, ChinaHungaryIcelandIndiaIndonesiaIran, Islamic Rep.IraqIrelandIsraelItalyJamaicaJapanJordanKazakhstanKenyaKiribatiKorea, Rep.KosovoKuwaitKyrgyz RepublicLao PDRLatviaLebanonLesothoLiberiaLibyaLithuaniaLuxembourgMacao SAR, ChinaMacedonia, FYRMadagascarMalawiMalaysiaMaldivesMaliMaltaMauritaniaMauritiusMexicoMicronesia, Fed. Sts.MoldovaMongoliaMontenegroMoroccoMozambiqueNamibiaNepalNetherlandsNew CaledoniaNew ZealandNicaraguaNigerNigeriaNorwayOmanPakistanPanamaPapua New GuineaParaguayPeruPhilippinesPolandPortugalPuerto RicoQatarRomaniaRussian FederationRwandaSaudi ArabiaSenegalSerbiaSeychellesSierra LeoneSingaporeSlovak RepublicSloveniaSolomon IslandsSomaliaSouth AfricaSouth SudanSpainSri LankaSt. Kitts and NevisSt. LuciaSt. Vincent and the GrenadinesSudanSurinameSwazilandSwedenSwitzerlandSyrian Arab RepublicTajikistanTanzaniaThailandTimor-LesteTogoTongaTrinidad and TobagoTunisiaTurkeyTurkmenistanUgandaUkraineUnited Arab EmiratesUnited KingdomUnited StatesUruguayUzbekistanVanuatuVenezuela, RBVietnamWest Bank and GazaYemen, Rep.ZambiaZimbabwe Timeline:
This timeline shows a graph from 1966 to 2016 of Canada. No data until 1965. Number of actual observations by date: 51.
Source name:
World Development Indicators
Source organization:
World Bank national accounts data, and OECD National Accounts data files.
Categories, topics:
Economy & Growth
Last updated:
apr 23, 2017
Indicators value changes by year
Minimum:
94.334
jan 1, 2002
Maximum:
102.31
jan 1, 2016
At the date of observation
Value
Absolute change
Change from previous value
jan 1, 1966
100.117
+100.117
0.0%
jan 1, 1967
99.969
-0.148
-0.15%
jan 1, 1968
98.984
-0.985
-0.99%
jan 1, 1969
98.785
-0.198
-0.2%
jan 1, 1970
99.897
+1.112
1.13%
jan 1, 1971
97.458
-2.439
-2.44%
jan 1, 1972
98.339
+0.881
0.9%
jan 1, 1973
99.064
+0.725
0.74%
jan 1, 1974
98.568
-0.496
-0.5%
jan 1, 1975
99.808
+1.241
1.26%
jan 1, 1976
101.669
+1.861
1.86%
jan 1, 1977
100.652
-1.017
-1.0%
jan 1, 1978
100.119
-0.533
-0.53%
jan 1, 1979
99.58
-0.539
-0.54%
jan 1, 1980
99.391
-0.189
-0.19%
jan 1, 1981
98.122
-1.269
-1.28%
jan 1, 1982
99.229
+1.108
1.13%
jan 1, 1983
96.115
-3.114
-3.14%
jan 1, 1984
96.745
+0.63
0.66%
jan 1, 1985
96.498
-0.248
-0.26%
jan 1, 1986
97.674
+1.177
1.22%
jan 1, 1987
99.023
+1.349
1.38%
jan 1, 1988
98.797
-0.226
-0.23%
jan 1, 1989
99.211
+0.414
0.42%
jan 1, 1990
99.94
+0.729
0.73%
jan 1, 1991
99.823
-0.117
-0.12%
jan 1, 1992
100.528
+0.705
0.71%
jan 1, 1993
100.358
-0.17
-0.17%
jan 1, 1994
99.981
-0.377
-0.38%
jan 1, 1995
98.84
-1.141
-1.14%
jan 1, 1996
96.887
-1.953
-1.98%
jan 1, 1997
96.081
-0.806
-0.83%
jan 1, 1998
98.099
+2.017
2.1%
jan 1, 1999
98.069
-0.029
-0.03%
jan 1, 2000
96.44
-1.63
-1.66%
jan 1, 2001
94.383
-2.057
-2.13%
jan 1, 2002
94.334
-0.049
-0.05%
jan 1, 2003
95.664
+1.33
1.41%
jan 1, 2004
96.188
+0.524
0.55%
jan 1, 2005
95.605
-0.583
-0.61%
jan 1, 2006
96.12
+0.515
0.54%
jan 1, 2007
97.322
+1.203
1.25%
jan 1, 2008
97.886
+0.563
0.58%
jan 1, 2009
98.278
+0.392
0.4%
jan 1, 2010
101.477
+3.199
3.25%
jan 1, 2011
101.917
+0.44
0.43%
jan 1, 2012
101.199
-0.717
-0.7%
jan 1, 2013
101.97
+0.771
0.76%
jan 1, 2014
101.572
-0.398
-0.39%
jan 1, 2015
100.943
-0.628
-0.62%
jan 1, 2016
102.31
+1.366
1.35%
Ranking of countries by current statistics by years


Comments: