29
/
en
AIzaSyAYiBZKx7MnpbEhh9jyipgxe19OcubqV5w
April 1, 2024
75068
Azerbaijan
AZE
true
2
1
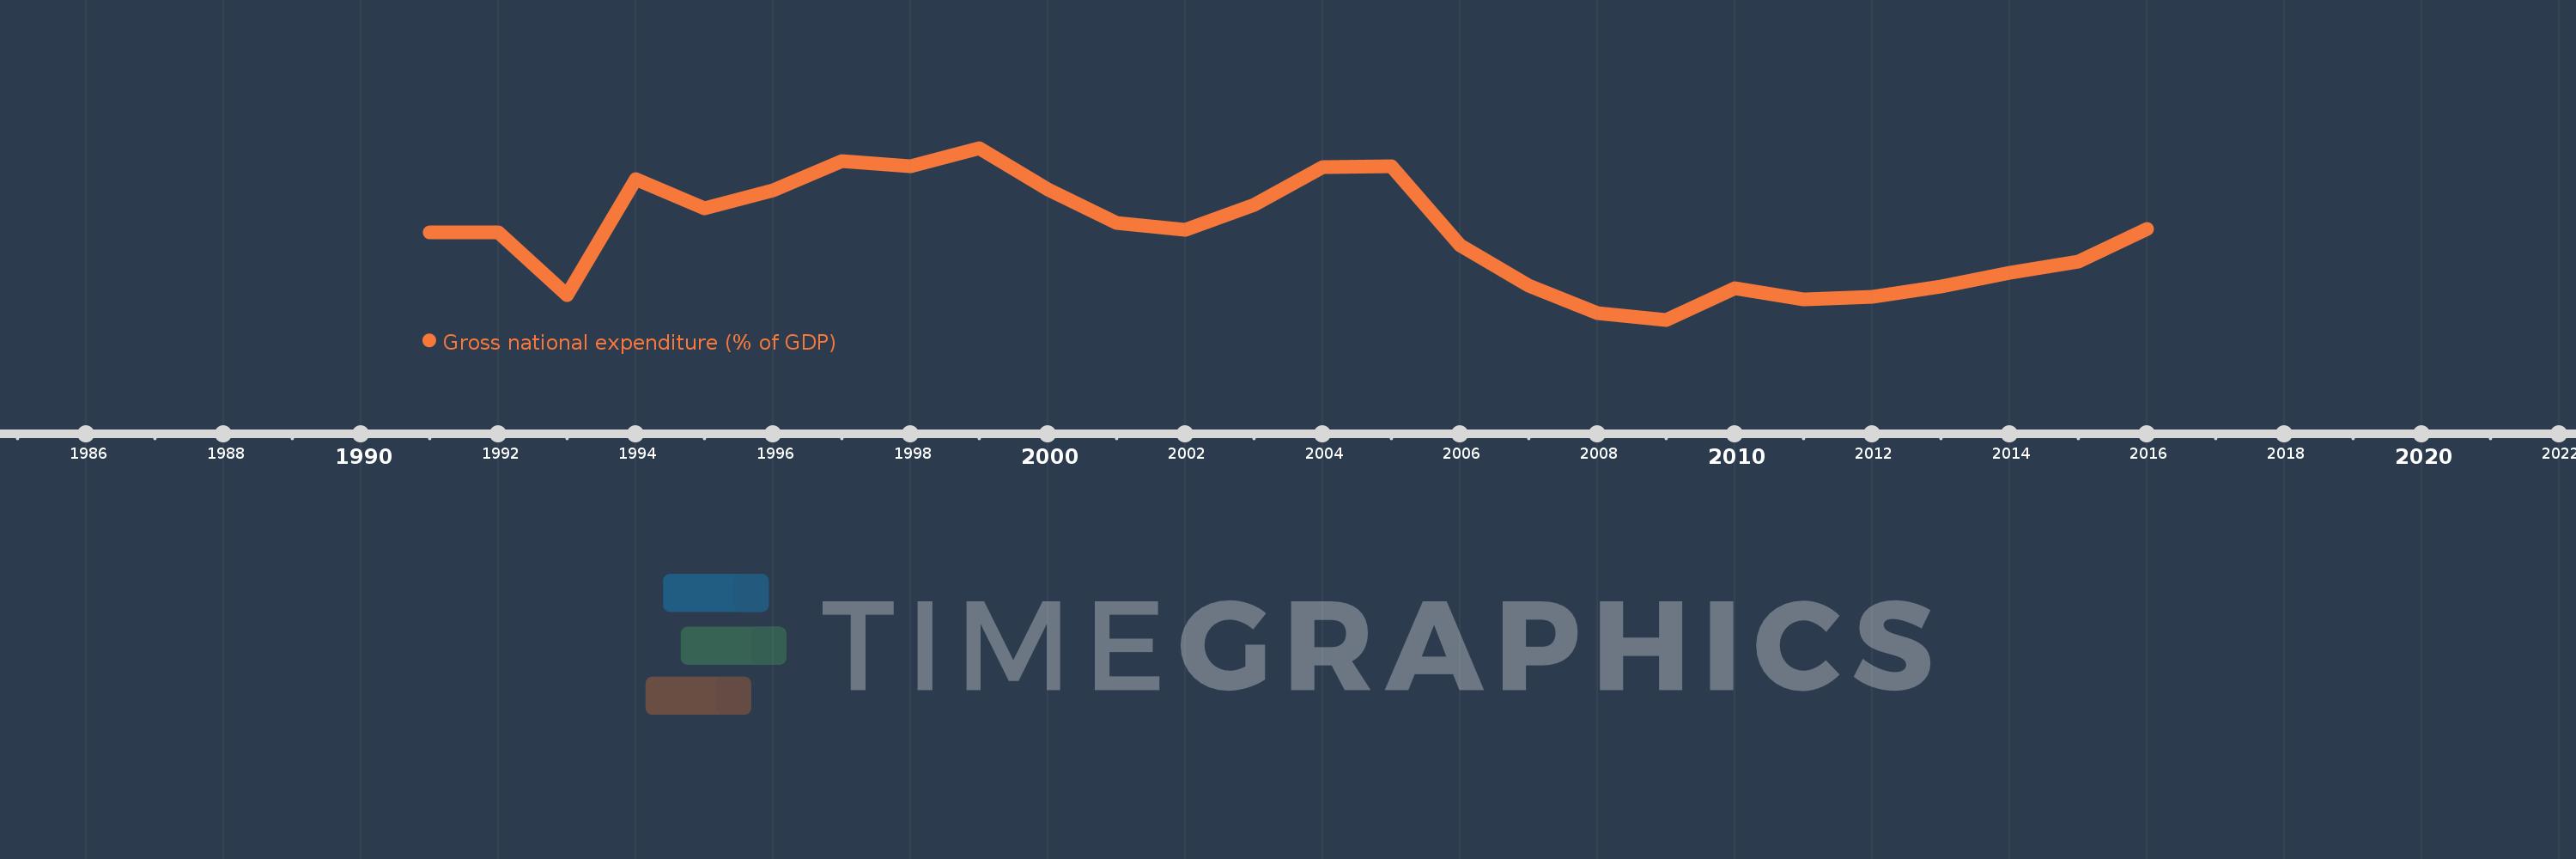
Gross national expenditure (% of GDP)
2016,2015,2014,2013,2012,2011,2010,2009,2008,2007,2006,2005,2004,2003,2002,2001,2000,1999,1998,1997,1996,1995,1994,1993,1992,1991
This statistics in other country:
AfghanistanAlbaniaAlgeriaAngolaAntigua and BarbudaArgentinaArmeniaArubaAustraliaAustriaAzerbaijanBahamas, TheBahrainBangladeshBarbadosBelarusBelgiumBelizeBeninBermudaBhutanBoliviaBosnia and HerzegovinaBotswanaBrazilBrunei DarussalamBulgariaBurkina FasoBurundiCabo VerdeCambodiaCameroonCanadaCentral African RepublicChadChileChinaColombiaComorosCongo, Dem. Rep.Congo, Rep.Costa RicaCote d'IvoireCroatiaCubaCyprusCzech RepublicDenmarkDjiboutiDominicaDominican RepublicEcuadorEgypt, Arab Rep.El SalvadorEquatorial GuineaEritreaEstoniaEthiopiaFaroe IslandsFijiFinlandFranceGabonGambia, TheGeorgiaGermanyGhanaGreeceGrenadaGuatemalaGuineaGuinea-BissauGuyanaHaitiHondurasHong Kong SAR, ChinaHungaryIcelandIndiaIndonesiaIran, Islamic Rep.IraqIrelandIsraelItalyJamaicaJapanJordanKazakhstanKenyaKiribatiKorea, Rep.KosovoKuwaitKyrgyz RepublicLao PDRLatviaLebanonLesothoLiberiaLibyaLithuaniaLuxembourgMacao SAR, ChinaMacedonia, FYRMadagascarMalawiMalaysiaMaldivesMaliMaltaMauritaniaMauritiusMexicoMicronesia, Fed. Sts.MoldovaMongoliaMontenegroMoroccoMozambiqueNamibiaNepalNetherlandsNew CaledoniaNew ZealandNicaraguaNigerNigeriaNorwayOmanPakistanPanamaPapua New GuineaParaguayPeruPhilippinesPolandPortugalPuerto RicoQatarRomaniaRussian FederationRwandaSaudi ArabiaSenegalSerbiaSeychellesSierra LeoneSingaporeSlovak RepublicSloveniaSolomon IslandsSomaliaSouth AfricaSouth SudanSpainSri LankaSt. Kitts and NevisSt. LuciaSt. Vincent and the GrenadinesSudanSurinameSwazilandSwedenSwitzerlandSyrian Arab RepublicTajikistanTanzaniaThailandTimor-LesteTogoTongaTrinidad and TobagoTunisiaTurkeyTurkmenistanUgandaUkraineUnited Arab EmiratesUnited KingdomUnited StatesUruguayUzbekistanVanuatuVenezuela, RBVietnamWest Bank and GazaYemen, Rep.ZambiaZimbabwe Timeline:
This timeline shows a graph from 1991 to 2016 of Azerbaijan. No data until 1990. Number of actual observations by date: 26.
Source name:
World Development Indicators
Source organization:
World Bank national accounts data, and OECD National Accounts data files.
Categories, topics:
Economy & Growth
Last updated:
apr 23, 2017
Indicators value changes by year
Minimum:
57.691
jan 1, 2009
Maximum:
131.829
jan 1, 1999
At the date of observation
Value
Absolute change
Change from previous value
jan 1, 1991
95.362
+95.362
0.0%
jan 1, 1992
95.546
+0.185
0.19%
jan 1, 1993
68.393
-27.154
-28.42%
jan 1, 1994
118.556
+50.163
73.35%
jan 1, 1995
105.907
-12.648
-10.67%
jan 1, 1996
113.609
+7.702
7.27%
jan 1, 1997
126.032
+12.423
10.93%
jan 1, 1998
124.002
-2.029
-1.61%
jan 1, 1999
131.829
+7.826
6.31%
jan 1, 2000
113.894
-17.935
-13.6%
jan 1, 2001
99.337
-14.557
-12.78%
jan 1, 2002
96.395
-2.942
-2.96%
jan 1, 2003
107.28
+10.886
11.29%
jan 1, 2004
123.54
+16.259
15.16%
jan 1, 2005
123.928
+0.389
0.31%
jan 1, 2006
89.961
-33.968
-27.41%
jan 1, 2007
72.253
-17.707
-19.68%
jan 1, 2008
60.383
-11.87
-16.43%
jan 1, 2009
57.691
-2.692
-4.46%
jan 1, 2010
71.473
+13.782
23.89%
jan 1, 2011
66.377
-5.096
-7.13%
jan 1, 2012
67.654
+1.278
1.92%
jan 1, 2013
71.93
+4.276
6.32%
jan 1, 2014
78.146
+6.216
8.64%
jan 1, 2015
82.934
+4.788
6.13%
jan 1, 2016
97.01
+14.076
16.97%
Ranking of countries by current statistics by years


Comments: