29
/
en
AIzaSyAYiBZKx7MnpbEhh9jyipgxe19OcubqV5w
April 1, 2024
182145
Luxembourg
LUX
true
2
1
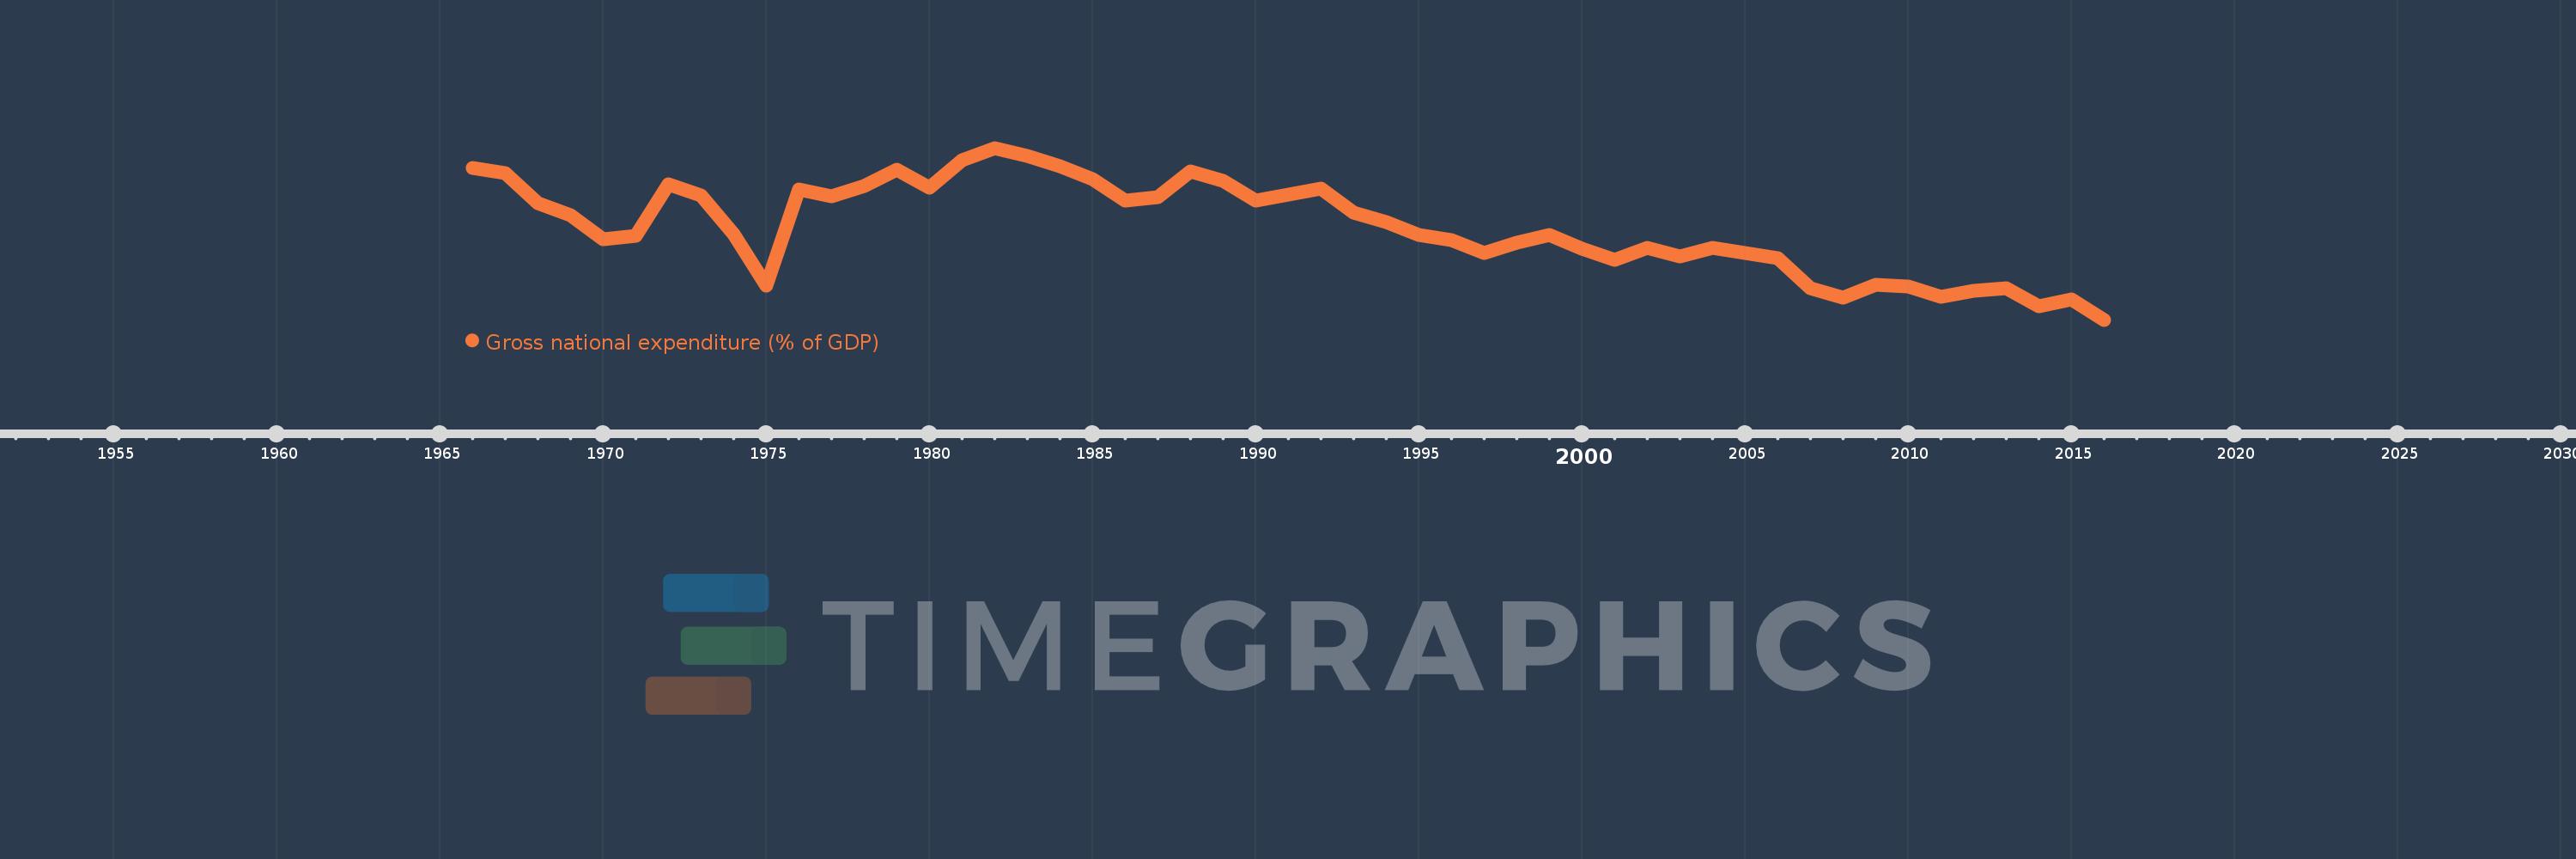
Gross national expenditure (% of GDP)
2016,2015,2014,2013,2012,2011,2010,2009,2008,2007,2006,2005,2004,2003,2002,2001,2000,1999,1998,1997,1996,1995,1994,1993,1992,1991,1990,1989,1988,1987,1986,1985,1984,1983,1982,1981,1980,1979,1978,1977,1976,1975,1974,1973,1972,1971,1970,1969,1968,1967,1966
This statistics in other country:
AfghanistanAlbaniaAlgeriaAngolaAntigua and BarbudaArgentinaArmeniaArubaAustraliaAustriaAzerbaijanBahamas, TheBahrainBangladeshBarbadosBelarusBelgiumBelizeBeninBermudaBhutanBoliviaBosnia and HerzegovinaBotswanaBrazilBrunei DarussalamBulgariaBurkina FasoBurundiCabo VerdeCambodiaCameroonCanadaCentral African RepublicChadChileChinaColombiaComorosCongo, Dem. Rep.Congo, Rep.Costa RicaCote d'IvoireCroatiaCubaCyprusCzech RepublicDenmarkDjiboutiDominicaDominican RepublicEcuadorEgypt, Arab Rep.El SalvadorEquatorial GuineaEritreaEstoniaEthiopiaFaroe IslandsFijiFinlandFranceGabonGambia, TheGeorgiaGermanyGhanaGreeceGrenadaGuatemalaGuineaGuinea-BissauGuyanaHaitiHondurasHong Kong SAR, ChinaHungaryIcelandIndiaIndonesiaIran, Islamic Rep.IraqIrelandIsraelItalyJamaicaJapanJordanKazakhstanKenyaKiribatiKorea, Rep.KosovoKuwaitKyrgyz RepublicLao PDRLatviaLebanonLesothoLiberiaLibyaLithuaniaLuxembourgMacao SAR, ChinaMacedonia, FYRMadagascarMalawiMalaysiaMaldivesMaliMaltaMauritaniaMauritiusMexicoMicronesia, Fed. Sts.MoldovaMongoliaMontenegroMoroccoMozambiqueNamibiaNepalNetherlandsNew CaledoniaNew ZealandNicaraguaNigerNigeriaNorwayOmanPakistanPanamaPapua New GuineaParaguayPeruPhilippinesPolandPortugalPuerto RicoQatarRomaniaRussian FederationRwandaSaudi ArabiaSenegalSerbiaSeychellesSierra LeoneSingaporeSlovak RepublicSloveniaSolomon IslandsSomaliaSouth AfricaSouth SudanSpainSri LankaSt. Kitts and NevisSt. LuciaSt. Vincent and the GrenadinesSudanSurinameSwazilandSwedenSwitzerlandSyrian Arab RepublicTajikistanTanzaniaThailandTimor-LesteTogoTongaTrinidad and TobagoTunisiaTurkeyTurkmenistanUgandaUkraineUnited Arab EmiratesUnited KingdomUnited StatesUruguayUzbekistanVanuatuVenezuela, RBVietnamWest Bank and GazaYemen, Rep.ZambiaZimbabwe Timeline:
This timeline shows a graph from 1966 to 2016 of Luxembourg. No data until 1965. Number of actual observations by date: 51.
Source name:
World Development Indicators
Source organization:
World Bank national accounts data, and OECD National Accounts data files.
Categories, topics:
Economy & Growth
Last updated:
apr 23, 2017
Indicators value changes by year
Minimum:
63.798
jan 1, 2016
Maximum:
95.856
jan 1, 1982
At the date of observation
Value
Absolute change
Change from previous value
jan 1, 1966
92.102
+92.102
0.0%
jan 1, 1967
91.16
-0.942
-1.02%
jan 1, 1968
85.586
-5.574
-6.11%
jan 1, 1969
83.385
-2.201
-2.57%
jan 1, 1970
78.849
-4.536
-5.44%
jan 1, 1971
79.439
+0.59
0.75%
jan 1, 1972
89.032
+9.592
12.07%
jan 1, 1973
87.041
-1.991
-2.24%
jan 1, 1974
79.823
-7.218
-8.29%
jan 1, 1975
70.148
-9.675
-12.12%
jan 1, 1976
88.062
+17.914
25.54%
jan 1, 1977
86.893
-1.17
-1.33%
jan 1, 1978
88.764
+1.871
2.15%
jan 1, 1979
91.729
+2.966
3.34%
jan 1, 1980
88.464
-3.265
-3.56%
jan 1, 1981
93.501
+5.037
5.69%
jan 1, 1982
95.856
+2.354
2.52%
jan 1, 1983
94.409
-1.447
-1.51%
jan 1, 1984
92.458
-1.951
-2.07%
jan 1, 1985
90.037
-2.421
-2.62%
jan 1, 1986
86.056
-3.981
-4.42%
jan 1, 1987
86.691
+0.636
0.74%
jan 1, 1988
91.542
+4.851
5.6%
jan 1, 1989
89.764
-1.778
-1.94%
jan 1, 1990
86.013
-3.75
-4.18%
jan 1, 1991
87.103
+1.089
1.27%
jan 1, 1992
88.256
+1.154
1.32%
jan 1, 1993
83.827
-4.429
-5.02%
jan 1, 1994
82.014
-1.813
-2.16%
jan 1, 1995
79.663
-2.352
-2.87%
jan 1, 1996
78.66
-1.002
-1.26%
jan 1, 1997
76.18
-2.48
-3.15%
jan 1, 1998
78.097
+1.917
2.52%
jan 1, 1999
79.645
+1.548
1.98%
jan 1, 2000
77.128
-2.517
-3.16%
jan 1, 2001
74.901
-2.227
-2.89%
jan 1, 2002
77.148
+2.247
3.0%
jan 1, 2003
75.605
-1.543
-2.0%
jan 1, 2004
77.205
+1.6
2.12%
jan 1, 2005
76.174
-1.032
-1.34%
jan 1, 2006
75.361
-0.812
-1.07%
jan 1, 2007
69.644
-5.717
-7.59%
jan 1, 2008
67.898
-1.747
-2.51%
jan 1, 2009
70.321
+2.423
3.57%
jan 1, 2010
69.93
-0.391
-0.56%
jan 1, 2011
68.121
-1.809
-2.59%
jan 1, 2012
69.226
+1.106
1.62%
jan 1, 2013
69.647
+0.421
0.61%
jan 1, 2014
66.344
-3.303
-4.74%
jan 1, 2015
67.611
+1.267
1.91%
jan 1, 2016
63.798
-3.813
-5.64%
Ranking of countries by current statistics by years


Comments: