29
/
en
AIzaSyAYiBZKx7MnpbEhh9jyipgxe19OcubqV5w
April 1, 2024
264671
Togo
TGO
true
2
1
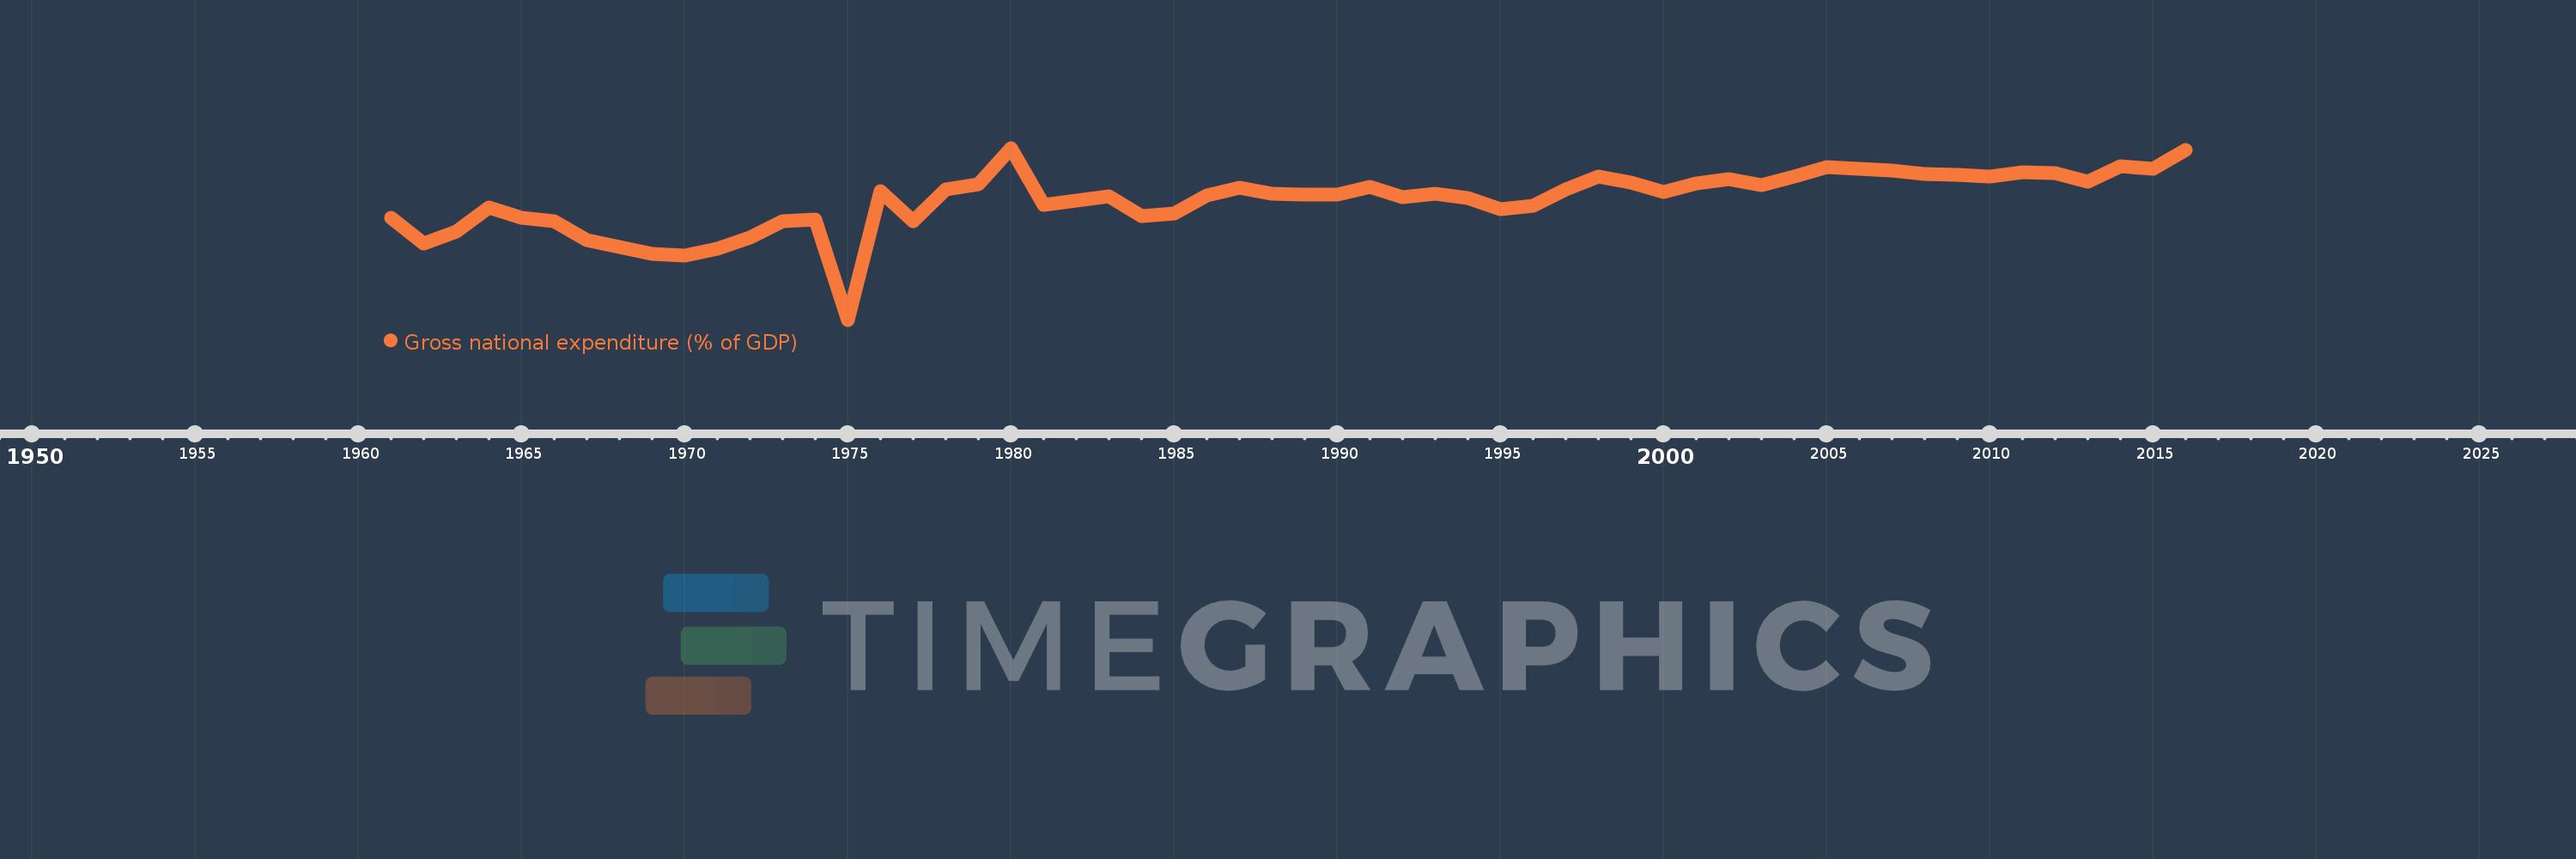
Gross national expenditure (% of GDP)
2016,2015,2014,2013,2012,2011,2010,2009,2008,2007,2006,2005,2004,2003,2002,2001,2000,1999,1998,1997,1996,1995,1994,1993,1992,1991,1990,1989,1988,1987,1986,1985,1984,1983,1982,1981,1980,1979,1978,1977,1976,1975,1974,1973,1972,1971,1970,1969,1968,1967,1966,1965,1964,1963,1962,1961
This statistics in other country:
AfghanistanAlbaniaAlgeriaAngolaAntigua and BarbudaArgentinaArmeniaArubaAustraliaAustriaAzerbaijanBahamas, TheBahrainBangladeshBarbadosBelarusBelgiumBelizeBeninBermudaBhutanBoliviaBosnia and HerzegovinaBotswanaBrazilBrunei DarussalamBulgariaBurkina FasoBurundiCabo VerdeCambodiaCameroonCanadaCentral African RepublicChadChileChinaColombiaComorosCongo, Dem. Rep.Congo, Rep.Costa RicaCote d'IvoireCroatiaCubaCyprusCzech RepublicDenmarkDjiboutiDominicaDominican RepublicEcuadorEgypt, Arab Rep.El SalvadorEquatorial GuineaEritreaEstoniaEthiopiaFaroe IslandsFijiFinlandFranceGabonGambia, TheGeorgiaGermanyGhanaGreeceGrenadaGuatemalaGuineaGuinea-BissauGuyanaHaitiHondurasHong Kong SAR, ChinaHungaryIcelandIndiaIndonesiaIran, Islamic Rep.IraqIrelandIsraelItalyJamaicaJapanJordanKazakhstanKenyaKiribatiKorea, Rep.KosovoKuwaitKyrgyz RepublicLao PDRLatviaLebanonLesothoLiberiaLibyaLithuaniaLuxembourgMacao SAR, ChinaMacedonia, FYRMadagascarMalawiMalaysiaMaldivesMaliMaltaMauritaniaMauritiusMexicoMicronesia, Fed. Sts.MoldovaMongoliaMontenegroMoroccoMozambiqueNamibiaNepalNetherlandsNew CaledoniaNew ZealandNicaraguaNigerNigeriaNorwayOmanPakistanPanamaPapua New GuineaParaguayPeruPhilippinesPolandPortugalPuerto RicoQatarRomaniaRussian FederationRwandaSaudi ArabiaSenegalSerbiaSeychellesSierra LeoneSingaporeSlovak RepublicSloveniaSolomon IslandsSomaliaSouth AfricaSouth SudanSpainSri LankaSt. Kitts and NevisSt. LuciaSt. Vincent and the GrenadinesSudanSurinameSwazilandSwedenSwitzerlandSyrian Arab RepublicTajikistanTanzaniaThailandTimor-LesteTogoTongaTrinidad and TobagoTunisiaTurkeyTurkmenistanUgandaUkraineUnited Arab EmiratesUnited KingdomUnited StatesUruguayUzbekistanVanuatuVenezuela, RBVietnamWest Bank and GazaYemen, Rep.ZambiaZimbabwe Timeline:
This timeline shows a graph from 1961 to 2016 of Togo. No data until 1960. Number of actual observations by date: 56.
Source name:
World Development Indicators
Source organization:
World Bank national accounts data, and OECD National Accounts data files.
Categories, topics:
Economy & Growth
Last updated:
apr 23, 2017
Indicators value changes by year
Minimum:
62.878
jan 1, 1975
Maximum:
126.233
jan 1, 1980
At the date of observation
Value
Absolute change
Change from previous value
jan 1, 1961
100.418
+100.418
0.0%
jan 1, 1962
90.982
-9.436
-9.4%
jan 1, 1963
95.377
+4.395
4.83%
jan 1, 1964
104.398
+9.021
9.46%
jan 1, 1965
100.507
-3.891
-3.73%
jan 1, 1966
99.13
-1.377
-1.37%
jan 1, 1967
92.338
-6.792
-6.85%
jan 1, 1968
89.678
-2.66
-2.88%
jan 1, 1969
87.081
-2.597
-2.9%
jan 1, 1970
86.45
-0.631
-0.72%
jan 1, 1971
89.153
+2.703
3.13%
jan 1, 1972
93.059
+3.907
4.38%
jan 1, 1973
99.2
+6.141
6.6%
jan 1, 1974
99.876
+0.675
0.68%
jan 1, 1975
62.878
-36.998
-37.04%
jan 1, 1976
110.287
+47.41
75.4%
jan 1, 1977
99.222
-11.065
-10.03%
jan 1, 1978
110.994
+11.771
11.86%
jan 1, 1979
112.903
+1.909
1.72%
jan 1, 1980
126.233
+13.33
11.81%
jan 1, 1981
105.289
-20.944
-16.59%
jan 1, 1982
106.73
+1.441
1.37%
jan 1, 1983
108.519
+1.788
1.68%
jan 1, 1984
101.268
-7.251
-6.68%
jan 1, 1985
102.103
+0.835
0.82%
jan 1, 1986
108.701
+6.597
6.46%
jan 1, 1987
111.704
+3.003
2.76%
jan 1, 1988
109.377
-2.327
-2.08%
jan 1, 1989
108.936
-0.44
-0.4%
jan 1, 1990
109.173
+0.237
0.22%
jan 1, 1991
111.861
+2.689
2.46%
jan 1, 1992
108.091
-3.771
-3.37%
jan 1, 1993
109.217
+1.126
1.04%
jan 1, 1994
107.711
-1.506
-1.38%
jan 1, 1995
103.706
-4.005
-3.72%
jan 1, 1996
104.973
+1.267
1.22%
jan 1, 1997
110.858
+5.886
5.61%
jan 1, 1998
115.831
+4.972
4.49%
jan 1, 1999
113.615
-2.215
-1.91%
jan 1, 2000
110.14
-3.475
-3.06%
jan 1, 2001
113.222
+3.082
2.8%
jan 1, 2002
114.683
+1.461
1.29%
jan 1, 2003
112.559
-2.124
-1.85%
jan 1, 2004
115.748
+3.189
2.83%
jan 1, 2005
119.305
+3.557
3.07%
jan 1, 2006
118.611
-0.694
-0.58%
jan 1, 2007
117.916
-0.695
-0.59%
jan 1, 2008
116.572
-1.344
-1.14%
jan 1, 2009
116.443
-0.129
-0.11%
jan 1, 2010
115.606
-0.836
-0.72%
jan 1, 2011
117.145
+1.539
1.33%
jan 1, 2012
116.895
-0.25
-0.21%
jan 1, 2013
113.834
-3.061
-2.62%
jan 1, 2014
119.616
+5.782
5.08%
jan 1, 2015
118.421
-1.195
-1.0%
jan 1, 2016
125.385
+6.964
5.88%
Ranking of countries by current statistics by years


Comments: