29
/
en
AIzaSyAYiBZKx7MnpbEhh9jyipgxe19OcubqV5w
April 1, 2024
161534
Italy
ITA
true
2
1
Gross national expenditure (% of GDP)
2016,2015,2014,2013,2012,2011,2010,2009,2008,2007,2006,2005,2004,2003,2002,2001,2000,1999,1998,1997,1996,1995,1994,1993,1992,1991,1990,1989,1988,1987,1986,1985,1984,1983,1982,1981,1980,1979,1978,1977,1976,1975,1974,1973,1972,1971,1970,1969,1968,1967,1966
This statistics in other country:
AfghanistanAlbaniaAlgeriaAngolaAntigua and BarbudaArgentinaArmeniaArubaAustraliaAustriaAzerbaijanBahamas, TheBahrainBangladeshBarbadosBelarusBelgiumBelizeBeninBermudaBhutanBoliviaBosnia and HerzegovinaBotswanaBrazilBrunei DarussalamBulgariaBurkina FasoBurundiCabo VerdeCambodiaCameroonCanadaCentral African RepublicChadChileChinaColombiaComorosCongo, Dem. Rep.Congo, Rep.Costa RicaCote d'IvoireCroatiaCubaCyprusCzech RepublicDenmarkDjiboutiDominicaDominican RepublicEcuadorEgypt, Arab Rep.El SalvadorEquatorial GuineaEritreaEstoniaEthiopiaFaroe IslandsFijiFinlandFranceGabonGambia, TheGeorgiaGermanyGhanaGreeceGrenadaGuatemalaGuineaGuinea-BissauGuyanaHaitiHondurasHong Kong SAR, ChinaHungaryIcelandIndiaIndonesiaIran, Islamic Rep.IraqIrelandIsraelItalyJamaicaJapanJordanKazakhstanKenyaKiribatiKorea, Rep.KosovoKuwaitKyrgyz RepublicLao PDRLatviaLebanonLesothoLiberiaLibyaLithuaniaLuxembourgMacao SAR, ChinaMacedonia, FYRMadagascarMalawiMalaysiaMaldivesMaliMaltaMauritaniaMauritiusMexicoMicronesia, Fed. Sts.MoldovaMongoliaMontenegroMoroccoMozambiqueNamibiaNepalNetherlandsNew CaledoniaNew ZealandNicaraguaNigerNigeriaNorwayOmanPakistanPanamaPapua New GuineaParaguayPeruPhilippinesPolandPortugalPuerto RicoQatarRomaniaRussian FederationRwandaSaudi ArabiaSenegalSerbiaSeychellesSierra LeoneSingaporeSlovak RepublicSloveniaSolomon IslandsSomaliaSouth AfricaSouth SudanSpainSri LankaSt. Kitts and NevisSt. LuciaSt. Vincent and the GrenadinesSudanSurinameSwazilandSwedenSwitzerlandSyrian Arab RepublicTajikistanTanzaniaThailandTimor-LesteTogoTongaTrinidad and TobagoTunisiaTurkeyTurkmenistanUgandaUkraineUnited Arab EmiratesUnited KingdomUnited StatesUruguayUzbekistanVanuatuVenezuela, RBVietnamWest Bank and GazaYemen, Rep.ZambiaZimbabwe Timeline:
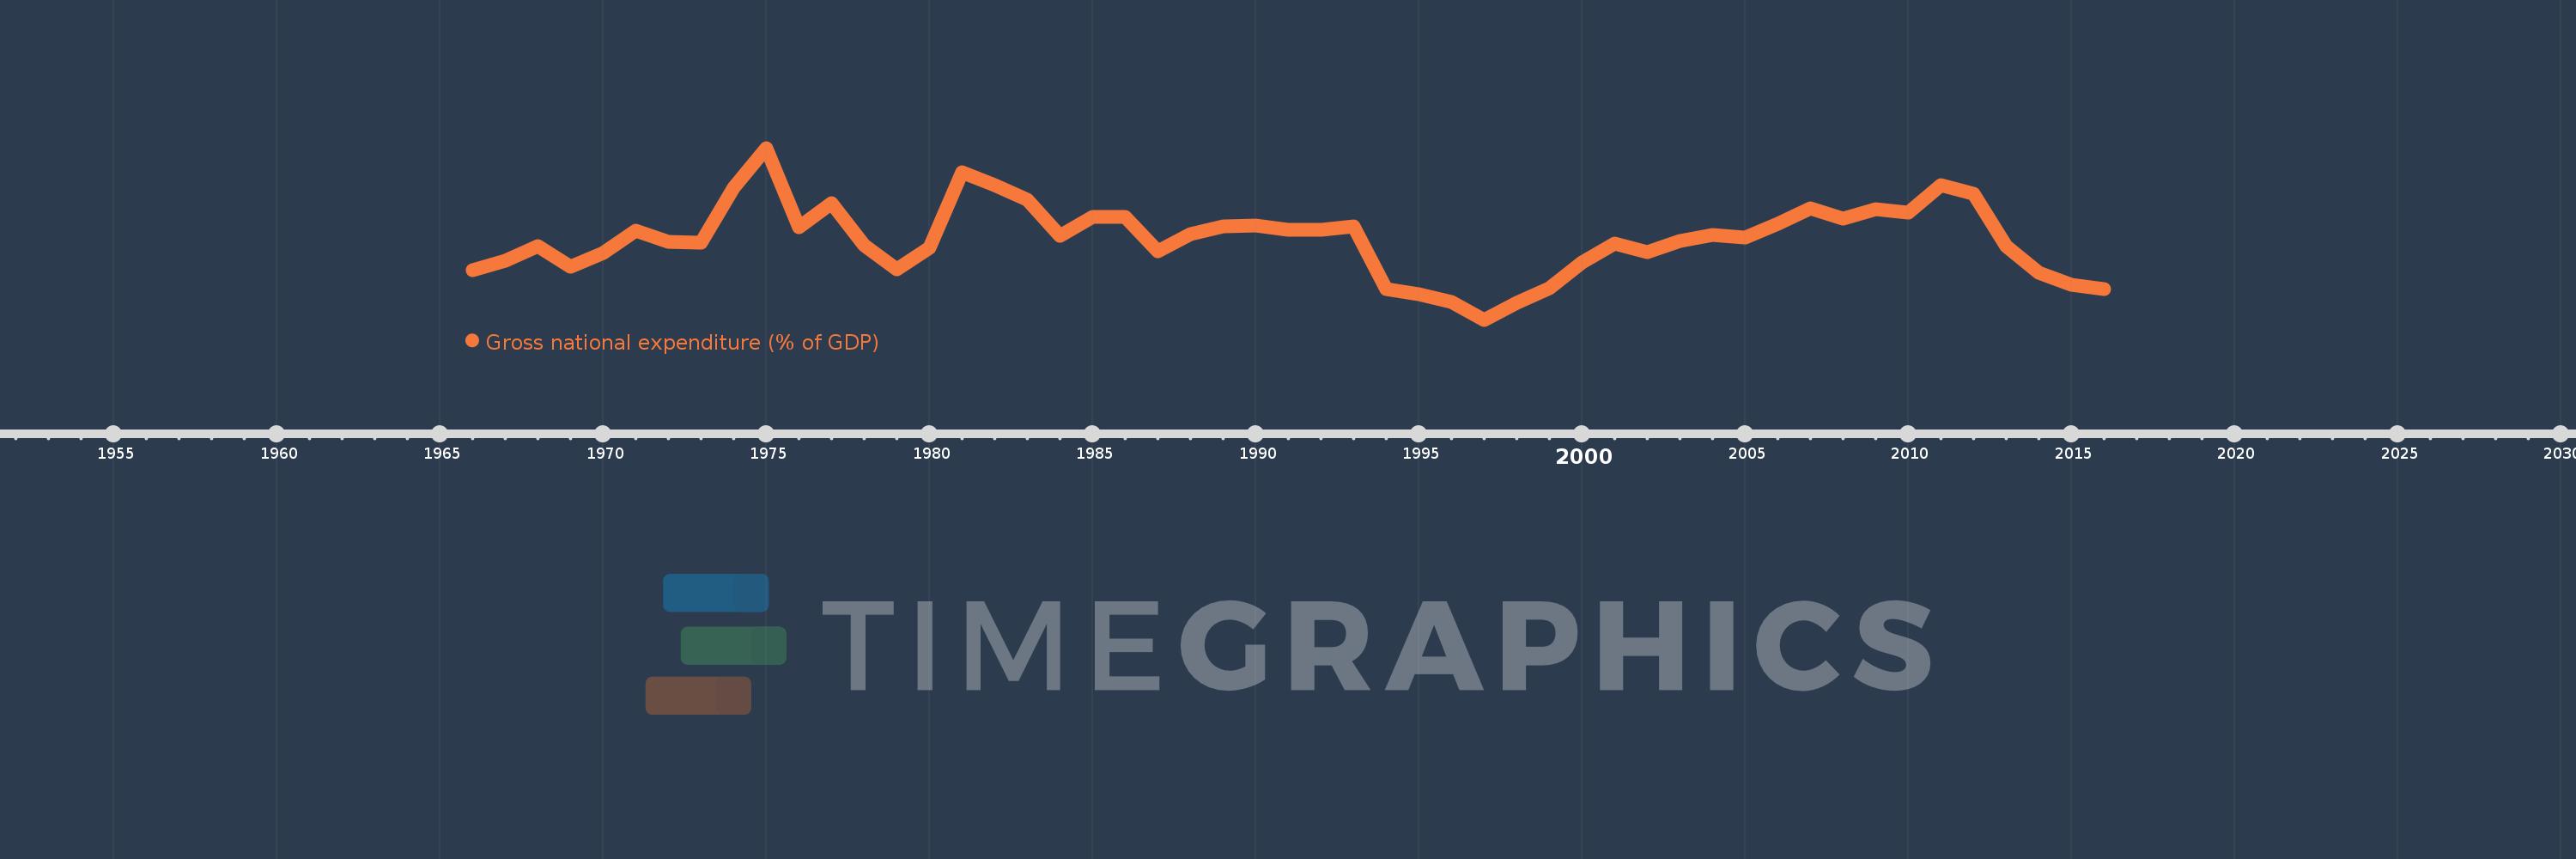
This timeline shows a graph from 1966 to 2016 of Italy. No data until 1965. Number of actual observations by date: 51.
Source name:
World Development Indicators
Source organization:
World Bank national accounts data, and OECD National Accounts data files.
Categories, topics:
Economy & Growth
Last updated:
apr 23, 2017
Indicators value changes by year
Minimum:
95.457
jan 1, 1997
Maximum:
103.764
jan 1, 1975
At the date of observation
Value
Absolute change
Change from previous value
jan 1, 1966
97.838
+97.838
0.0%
jan 1, 1967
98.309
+0.471
0.48%
jan 1, 1968
99.035
+0.726
0.74%
jan 1, 1969
98.033
-1.003
-1.01%
jan 1, 1970
98.702
+0.67
0.68%
jan 1, 1971
99.77
+1.067
1.08%
jan 1, 1972
99.232
-0.537
-0.54%
jan 1, 1973
99.192
-0.04
-0.04%
jan 1, 1974
101.858
+2.666
2.69%
jan 1, 1975
103.764
+1.907
1.87%
jan 1, 1976
99.934
-3.83
-3.69%
jan 1, 1977
101.104
+1.17
1.17%
jan 1, 1978
99.045
-2.059
-2.04%
jan 1, 1979
97.902
-1.143
-1.15%
jan 1, 1980
98.935
+1.032
1.05%
jan 1, 1981
102.606
+3.672
3.71%
jan 1, 1982
101.955
-0.651
-0.63%
jan 1, 1983
101.27
-0.685
-0.67%
jan 1, 1984
99.52
-1.75
-1.73%
jan 1, 1985
100.426
+0.905
0.91%
jan 1, 1986
100.411
-0.015
-0.01%
jan 1, 1987
98.75
-1.661
-1.65%
jan 1, 1988
99.591
+0.842
0.85%
jan 1, 1989
99.953
+0.362
0.36%
jan 1, 1990
100.018
+0.064
0.06%
jan 1, 1991
99.8
-0.217
-0.22%
jan 1, 1992
99.804
+0.004
0.0%
jan 1, 1993
99.953
+0.149
0.15%
jan 1, 1994
96.95
-3.004
-3.01%
jan 1, 1995
96.701
-0.249
-0.26%
jan 1, 1996
96.326
-0.375
-0.39%
jan 1, 1997
95.457
-0.869
-0.9%
jan 1, 1998
96.281
+0.824
0.86%
jan 1, 1999
96.965
+0.683
0.71%
jan 1, 2000
98.224
+1.26
1.3%
jan 1, 2001
99.159
+0.935
0.95%
jan 1, 2002
98.745
-0.414
-0.42%
jan 1, 2003
99.254
+0.509
0.52%
jan 1, 2004
99.547
+0.293
0.3%
jan 1, 2005
99.418
-0.129
-0.13%
jan 1, 2006
100.11
+0.693
0.7%
jan 1, 2007
100.836
+0.726
0.73%
jan 1, 2008
100.359
-0.477
-0.47%
jan 1, 2009
100.789
+0.43
0.43%
jan 1, 2010
100.656
-0.133
-0.13%
jan 1, 2011
101.969
+1.313
1.3%
jan 1, 2012
101.57
-0.399
-0.39%
jan 1, 2013
99.012
-2.558
-2.52%
jan 1, 2014
97.741
-1.271
-1.28%
jan 1, 2015
97.143
-0.598
-0.61%
jan 1, 2016
96.923
-0.219
-0.23%
Ranking of countries by current statistics by years


Comments: