29
/
en
AIzaSyAYiBZKx7MnpbEhh9jyipgxe19OcubqV5w
April 1, 2024
223634
Philippines
PHL
true
2
1
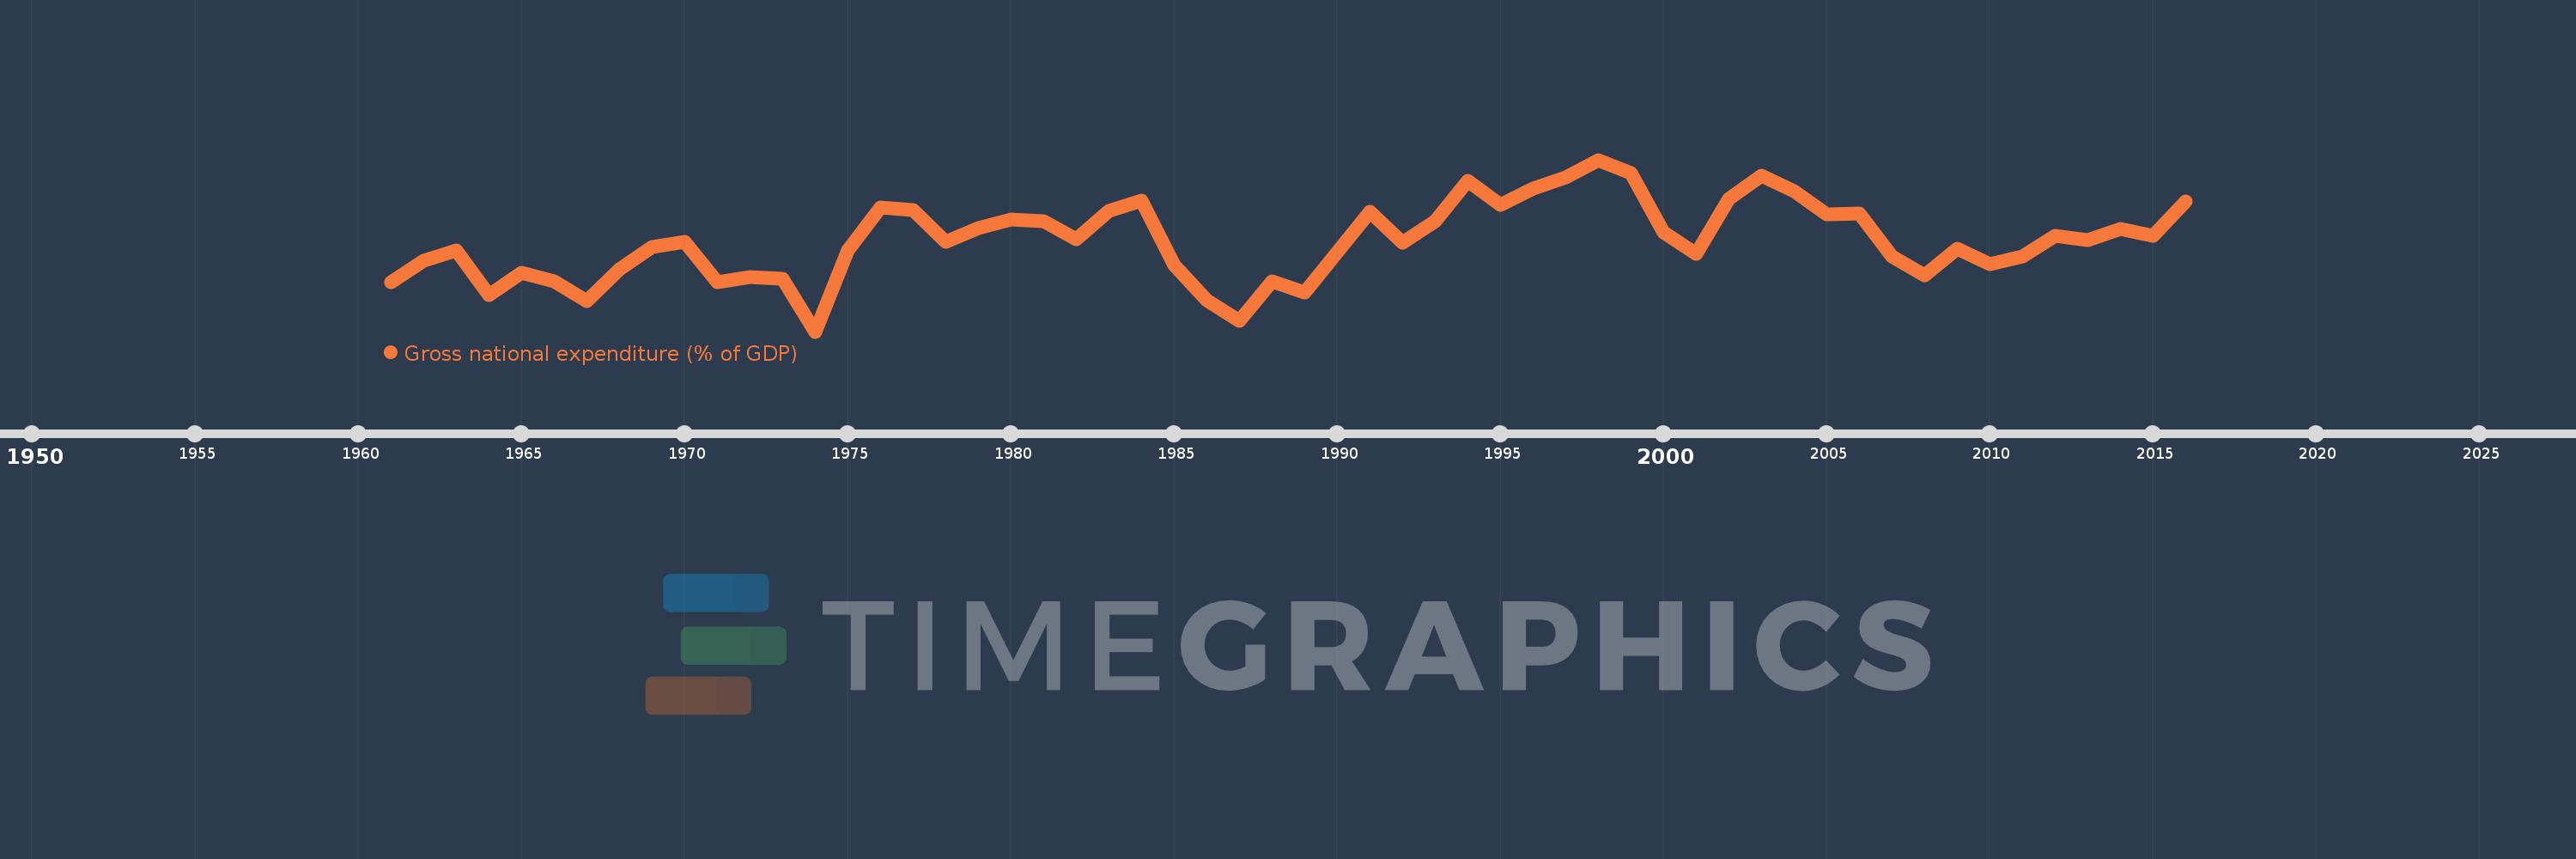
Gross national expenditure (% of GDP)
2016,2015,2014,2013,2012,2011,2010,2009,2008,2007,2006,2005,2004,2003,2002,2001,2000,1999,1998,1997,1996,1995,1994,1993,1992,1991,1990,1989,1988,1987,1986,1985,1984,1983,1982,1981,1980,1979,1978,1977,1976,1975,1974,1973,1972,1971,1970,1969,1968,1967,1966,1965,1964,1963,1962,1961
This statistics in other country:
AfghanistanAlbaniaAlgeriaAngolaAntigua and BarbudaArgentinaArmeniaArubaAustraliaAustriaAzerbaijanBahamas, TheBahrainBangladeshBarbadosBelarusBelgiumBelizeBeninBermudaBhutanBoliviaBosnia and HerzegovinaBotswanaBrazilBrunei DarussalamBulgariaBurkina FasoBurundiCabo VerdeCambodiaCameroonCanadaCentral African RepublicChadChileChinaColombiaComorosCongo, Dem. Rep.Congo, Rep.Costa RicaCote d'IvoireCroatiaCubaCyprusCzech RepublicDenmarkDjiboutiDominicaDominican RepublicEcuadorEgypt, Arab Rep.El SalvadorEquatorial GuineaEritreaEstoniaEthiopiaFaroe IslandsFijiFinlandFranceGabonGambia, TheGeorgiaGermanyGhanaGreeceGrenadaGuatemalaGuineaGuinea-BissauGuyanaHaitiHondurasHong Kong SAR, ChinaHungaryIcelandIndiaIndonesiaIran, Islamic Rep.IraqIrelandIsraelItalyJamaicaJapanJordanKazakhstanKenyaKiribatiKorea, Rep.KosovoKuwaitKyrgyz RepublicLao PDRLatviaLebanonLesothoLiberiaLibyaLithuaniaLuxembourgMacao SAR, ChinaMacedonia, FYRMadagascarMalawiMalaysiaMaldivesMaliMaltaMauritaniaMauritiusMexicoMicronesia, Fed. Sts.MoldovaMongoliaMontenegroMoroccoMozambiqueNamibiaNepalNetherlandsNew CaledoniaNew ZealandNicaraguaNigerNigeriaNorwayOmanPakistanPanamaPapua New GuineaParaguayPeruPhilippinesPolandPortugalPuerto RicoQatarRomaniaRussian FederationRwandaSaudi ArabiaSenegalSerbiaSeychellesSierra LeoneSingaporeSlovak RepublicSloveniaSolomon IslandsSomaliaSouth AfricaSouth SudanSpainSri LankaSt. Kitts and NevisSt. LuciaSt. Vincent and the GrenadinesSudanSurinameSwazilandSwedenSwitzerlandSyrian Arab RepublicTajikistanTanzaniaThailandTimor-LesteTogoTongaTrinidad and TobagoTunisiaTurkeyTurkmenistanUgandaUkraineUnited Arab EmiratesUnited KingdomUnited StatesUruguayUzbekistanVanuatuVenezuela, RBVietnamWest Bank and GazaYemen, Rep.ZambiaZimbabwe Timeline:
This timeline shows a graph from 1961 to 2016 of Philippines. No data until 1960. Number of actual observations by date: 56.
Source name:
World Development Indicators
Source organization:
World Bank national accounts data, and OECD National Accounts data files.
Categories, topics:
Economy & Growth
Last updated:
apr 23, 2017
Indicators value changes by year
Minimum:
95.122
jan 1, 1974
Maximum:
110.337
jan 1, 1998
At the date of observation
Value
Absolute change
Change from previous value
jan 1, 1961
99.528
+99.528
0.0%
jan 1, 1962
101.432
+1.905
1.91%
jan 1, 1963
102.287
+0.855
0.84%
jan 1, 1964
98.337
-3.95
-3.86%
jan 1, 1965
100.306
+1.97
2.0%
jan 1, 1966
99.576
-0.731
-0.73%
jan 1, 1967
97.854
-1.722
-1.73%
jan 1, 1968
100.64
+2.787
2.85%
jan 1, 1969
102.588
+1.948
1.94%
jan 1, 1970
103.049
+0.461
0.45%
jan 1, 1971
99.468
-3.58
-3.47%
jan 1, 1972
99.96
+0.492
0.49%
jan 1, 1973
99.789
-0.171
-0.17%
jan 1, 1974
95.122
-4.667
-4.68%
jan 1, 1975
102.331
+7.209
7.58%
jan 1, 1976
106.092
+3.76
3.67%
jan 1, 1977
105.922
-0.17
-0.16%
jan 1, 1978
103.067
-2.855
-2.7%
jan 1, 1979
104.27
+1.203
1.17%
jan 1, 1980
105.076
+0.806
0.77%
jan 1, 1981
104.898
-0.177
-0.17%
jan 1, 1982
103.338
-1.561
-1.49%
jan 1, 1983
105.801
+2.464
2.38%
jan 1, 1984
106.741
+0.94
0.89%
jan 1, 1985
101.049
-5.692
-5.33%
jan 1, 1986
97.878
-3.171
-3.14%
jan 1, 1987
96.046
-1.832
-1.87%
jan 1, 1988
99.579
+3.533
3.68%
jan 1, 1989
98.546
-1.033
-1.04%
jan 1, 1990
102.156
+3.61
3.66%
jan 1, 1991
105.768
+3.611
3.54%
jan 1, 1992
102.99
-2.777
-2.63%
jan 1, 1993
104.898
+1.908
1.85%
jan 1, 1994
108.447
+3.549
3.38%
jan 1, 1995
106.308
-2.139
-1.97%
jan 1, 1996
107.824
+1.516
1.43%
jan 1, 1997
108.787
+0.963
0.89%
jan 1, 1998
110.337
+1.551
1.43%
jan 1, 1999
109.134
-1.204
-1.09%
jan 1, 2000
103.931
-5.203
-4.77%
jan 1, 2001
101.991
-1.94
-1.87%
jan 1, 2002
106.855
+4.864
4.77%
jan 1, 2003
108.941
+2.086
1.95%
jan 1, 2004
107.535
-1.406
-1.29%
jan 1, 2005
105.497
-2.038
-1.9%
jan 1, 2006
105.605
+0.107
0.1%
jan 1, 2007
101.785
-3.82
-3.62%
jan 1, 2008
100.098
-1.687
-1.66%
jan 1, 2009
102.458
+2.36
2.36%
jan 1, 2010
101.126
-1.333
-1.3%
jan 1, 2011
101.813
+0.687
0.68%
jan 1, 2012
103.636
+1.823
1.79%
jan 1, 2013
103.261
-0.375
-0.36%
jan 1, 2014
104.21
+0.949
0.92%
jan 1, 2015
103.574
-0.636
-0.61%
jan 1, 2016
106.657
+3.083
2.98%
Ranking of countries by current statistics by years


Comments: