29
/
en
AIzaSyAYiBZKx7MnpbEhh9jyipgxe19OcubqV5w
April 1, 2024
123561
Ecuador
ECU
true
2
1
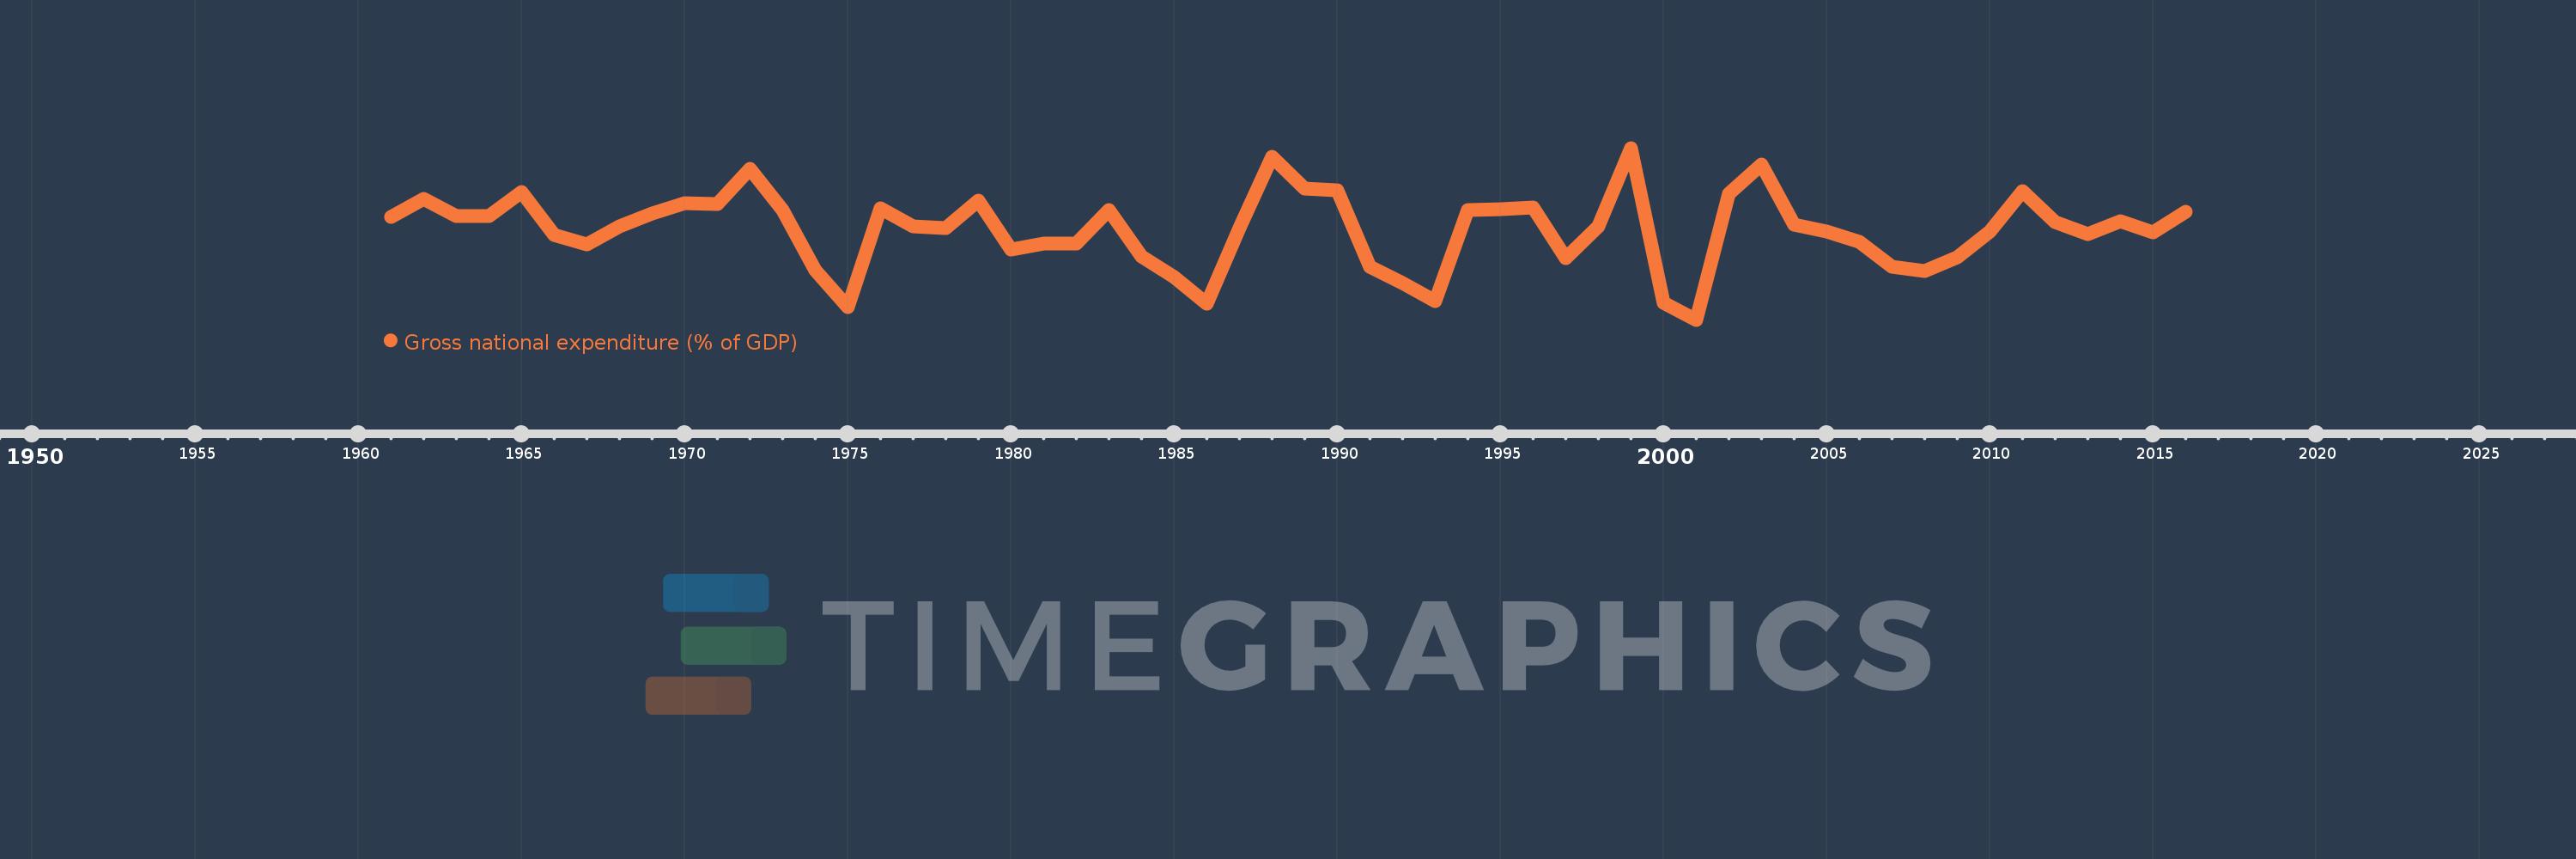
Gross national expenditure (% of GDP)
2016,2015,2014,2013,2012,2011,2010,2009,2008,2007,2006,2005,2004,2003,2002,2001,2000,1999,1998,1997,1996,1995,1994,1993,1992,1991,1990,1989,1988,1987,1986,1985,1984,1983,1982,1981,1980,1979,1978,1977,1976,1975,1974,1973,1972,1971,1970,1969,1968,1967,1966,1965,1964,1963,1962,1961
This statistics in other country:
AfghanistanAlbaniaAlgeriaAngolaAntigua and BarbudaArgentinaArmeniaArubaAustraliaAustriaAzerbaijanBahamas, TheBahrainBangladeshBarbadosBelarusBelgiumBelizeBeninBermudaBhutanBoliviaBosnia and HerzegovinaBotswanaBrazilBrunei DarussalamBulgariaBurkina FasoBurundiCabo VerdeCambodiaCameroonCanadaCentral African RepublicChadChileChinaColombiaComorosCongo, Dem. Rep.Congo, Rep.Costa RicaCote d'IvoireCroatiaCubaCyprusCzech RepublicDenmarkDjiboutiDominicaDominican RepublicEcuadorEgypt, Arab Rep.El SalvadorEquatorial GuineaEritreaEstoniaEthiopiaFaroe IslandsFijiFinlandFranceGabonGambia, TheGeorgiaGermanyGhanaGreeceGrenadaGuatemalaGuineaGuinea-BissauGuyanaHaitiHondurasHong Kong SAR, ChinaHungaryIcelandIndiaIndonesiaIran, Islamic Rep.IraqIrelandIsraelItalyJamaicaJapanJordanKazakhstanKenyaKiribatiKorea, Rep.KosovoKuwaitKyrgyz RepublicLao PDRLatviaLebanonLesothoLiberiaLibyaLithuaniaLuxembourgMacao SAR, ChinaMacedonia, FYRMadagascarMalawiMalaysiaMaldivesMaliMaltaMauritaniaMauritiusMexicoMicronesia, Fed. Sts.MoldovaMongoliaMontenegroMoroccoMozambiqueNamibiaNepalNetherlandsNew CaledoniaNew ZealandNicaraguaNigerNigeriaNorwayOmanPakistanPanamaPapua New GuineaParaguayPeruPhilippinesPolandPortugalPuerto RicoQatarRomaniaRussian FederationRwandaSaudi ArabiaSenegalSerbiaSeychellesSierra LeoneSingaporeSlovak RepublicSloveniaSolomon IslandsSomaliaSouth AfricaSouth SudanSpainSri LankaSt. Kitts and NevisSt. LuciaSt. Vincent and the GrenadinesSudanSurinameSwazilandSwedenSwitzerlandSyrian Arab RepublicTajikistanTanzaniaThailandTimor-LesteTogoTongaTrinidad and TobagoTunisiaTurkeyTurkmenistanUgandaUkraineUnited Arab EmiratesUnited KingdomUnited StatesUruguayUzbekistanVanuatuVenezuela, RBVietnamWest Bank and GazaYemen, Rep.ZambiaZimbabwe Timeline:
This timeline shows a graph from 1961 to 2016 of Ecuador. No data until 1960. Number of actual observations by date: 56.
Source name:
World Development Indicators
Source organization:
World Bank national accounts data, and OECD National Accounts data files.
Categories, topics:
Economy & Growth
Last updated:
apr 23, 2017
Indicators value changes by year
Maximum:
107.611
jan 1, 1999
At the date of observation
Value
Absolute change
Change from previous value
jan 1, 1961
102.636
+102.636
0.0%
jan 1, 1962
103.961
+1.325
1.29%
jan 1, 1963
102.664
-1.297
-1.25%
jan 1, 1964
102.664
-0.001
0.0%
jan 1, 1965
104.412
+1.748
1.7%
jan 1, 1966
101.311
-3.101
-2.97%
jan 1, 1967
100.629
-0.682
-0.67%
jan 1, 1968
101.924
+1.296
1.29%
jan 1, 1969
102.876
+0.952
0.93%
jan 1, 1970
103.599
+0.723
0.7%
jan 1, 1971
103.569
-0.031
-0.03%
jan 1, 1972
106.11
+2.541
2.45%
jan 1, 1973
103.142
-2.968
-2.8%
jan 1, 1974
98.782
-4.361
-4.23%
jan 1, 1975
96.1
-2.681
-2.71%
jan 1, 1976
103.263
+7.163
7.45%
jan 1, 1977
101.943
-1.321
-1.28%
jan 1, 1978
101.836
-0.106
-0.1%
jan 1, 1979
103.832
+1.995
1.96%
jan 1, 1980
100.263
-3.568
-3.44%
jan 1, 1981
100.729
+0.466
0.46%
jan 1, 1982
100.68
-0.049
-0.05%
jan 1, 1983
103.1
+2.42
2.4%
jan 1, 1984
99.757
-3.343
-3.24%
jan 1, 1985
98.305
-1.451
-1.45%
jan 1, 1986
96.355
-1.951
-1.98%
jan 1, 1987
101.852
+5.497
5.71%
jan 1, 1988
106.999
+5.147
5.05%
jan 1, 1989
104.651
-2.348
-2.19%
jan 1, 1990
104.547
-0.104
-0.1%
jan 1, 1991
99.066
-5.481
-5.24%
jan 1, 1992
97.847
-1.219
-1.23%
jan 1, 1993
96.539
-1.308
-1.34%
jan 1, 1994
103.1
+6.56
6.8%
jan 1, 1995
103.218
+0.119
0.12%
jan 1, 1996
103.337
+0.119
0.12%
jan 1, 1997
99.669
-3.668
-3.55%
jan 1, 1998
101.947
+2.278
2.29%
jan 1, 1999
107.611
+5.664
5.56%
jan 1, 2000
96.446
-11.165
-10.38%
jan 1, 2001
95.21
-1.237
-1.28%
jan 1, 2002
104.3
+9.09
9.55%
jan 1, 2003
106.392
+2.092
2.01%
jan 1, 2004
102.045
-4.347
-4.09%
jan 1, 2005
101.557
-0.488
-0.48%
jan 1, 2006
100.863
-0.693
-0.68%
jan 1, 2007
99.044
-1.82
-1.8%
jan 1, 2008
98.724
-0.32
-0.32%
jan 1, 2009
99.73
+1.006
1.02%
jan 1, 2010
101.607
+1.877
1.88%
jan 1, 2011
104.513
+2.907
2.86%
jan 1, 2012
102.248
-2.265
-2.17%
jan 1, 2013
101.421
-0.826
-0.81%
jan 1, 2014
102.33
+0.908
0.9%
jan 1, 2015
101.506
-0.824
-0.8%
jan 1, 2016
102.987
+1.481
1.46%
Ranking of countries by current statistics by years


Comments: