29
/
en
AIzaSyAYiBZKx7MnpbEhh9jyipgxe19OcubqV5w
April 1, 2024
270563
Turkmenistan
TKM
true
2
1
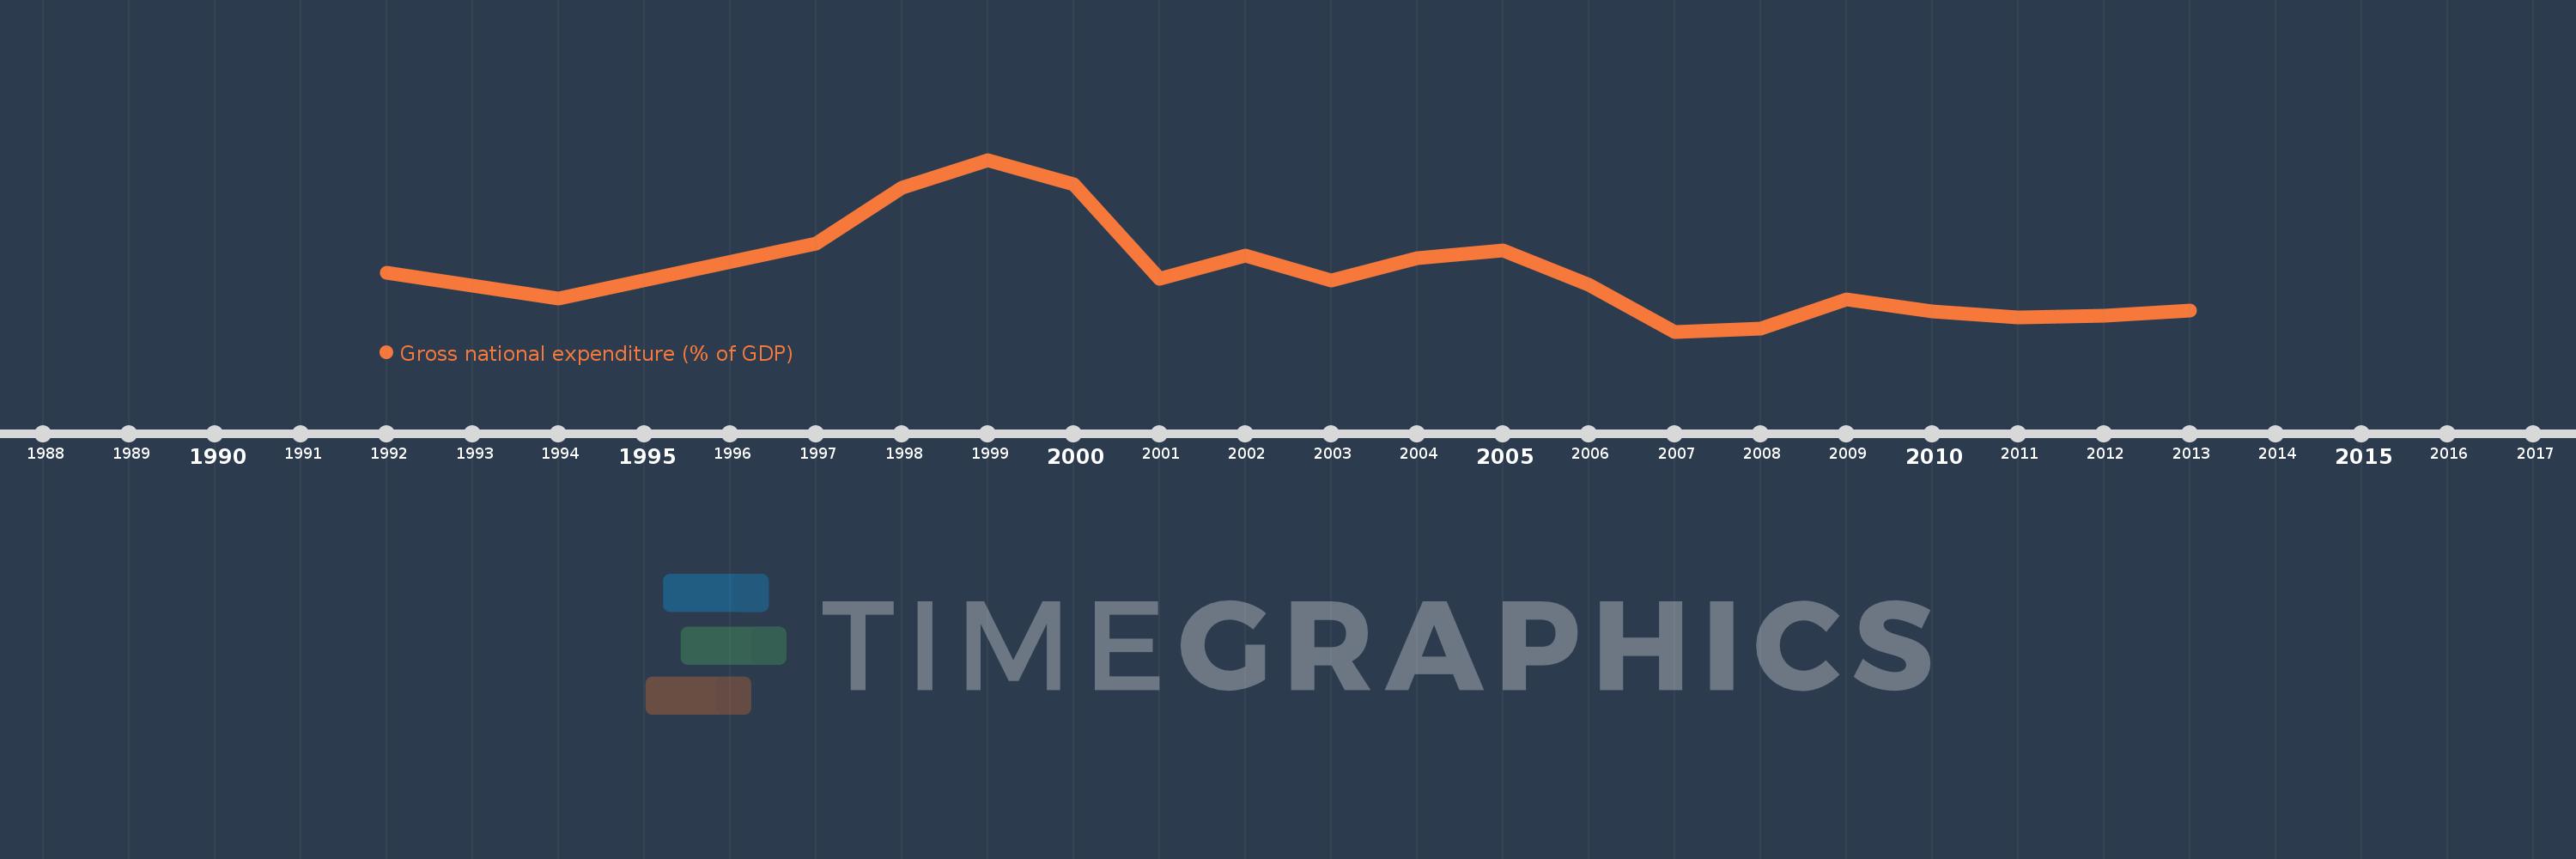
Gross national expenditure (% of GDP)
2013,2012,2011,2010,2009,2008,2007,2006,2005,2004,2003,2002,2001,2000,1999,1998,1997,1994,1992
This statistics in other country:
AfghanistanAlbaniaAlgeriaAngolaAntigua and BarbudaArgentinaArmeniaArubaAustraliaAustriaAzerbaijanBahamas, TheBahrainBangladeshBarbadosBelarusBelgiumBelizeBeninBermudaBhutanBoliviaBosnia and HerzegovinaBotswanaBrazilBrunei DarussalamBulgariaBurkina FasoBurundiCabo VerdeCambodiaCameroonCanadaCentral African RepublicChadChileChinaColombiaComorosCongo, Dem. Rep.Congo, Rep.Costa RicaCote d'IvoireCroatiaCubaCyprusCzech RepublicDenmarkDjiboutiDominicaDominican RepublicEcuadorEgypt, Arab Rep.El SalvadorEquatorial GuineaEritreaEstoniaEthiopiaFaroe IslandsFijiFinlandFranceGabonGambia, TheGeorgiaGermanyGhanaGreeceGrenadaGuatemalaGuineaGuinea-BissauGuyanaHaitiHondurasHong Kong SAR, ChinaHungaryIcelandIndiaIndonesiaIran, Islamic Rep.IraqIrelandIsraelItalyJamaicaJapanJordanKazakhstanKenyaKiribatiKorea, Rep.KosovoKuwaitKyrgyz RepublicLao PDRLatviaLebanonLesothoLiberiaLibyaLithuaniaLuxembourgMacao SAR, ChinaMacedonia, FYRMadagascarMalawiMalaysiaMaldivesMaliMaltaMauritaniaMauritiusMexicoMicronesia, Fed. Sts.MoldovaMongoliaMontenegroMoroccoMozambiqueNamibiaNepalNetherlandsNew CaledoniaNew ZealandNicaraguaNigerNigeriaNorwayOmanPakistanPanamaPapua New GuineaParaguayPeruPhilippinesPolandPortugalPuerto RicoQatarRomaniaRussian FederationRwandaSaudi ArabiaSenegalSerbiaSeychellesSierra LeoneSingaporeSlovak RepublicSloveniaSolomon IslandsSomaliaSouth AfricaSouth SudanSpainSri LankaSt. Kitts and NevisSt. LuciaSt. Vincent and the GrenadinesSudanSurinameSwazilandSwedenSwitzerlandSyrian Arab RepublicTajikistanTanzaniaThailandTimor-LesteTogoTongaTrinidad and TobagoTunisiaTurkeyTurkmenistanUgandaUkraineUnited Arab EmiratesUnited KingdomUnited StatesUruguayUzbekistanVanuatuVenezuela, RBVietnamWest Bank and GazaYemen, Rep.ZambiaZimbabwe Timeline:
This timeline shows a graph from 1992 to 2013 of Turkmenistan. No data until 1991. Number of actual observations by date: 19.
Source name:
World Development Indicators
Source organization:
World Bank national accounts data, and OECD National Accounts data files.
Categories, topics:
Economy & Growth
Last updated:
apr 23, 2017
Indicators value changes by year
Maximum:
138.147
jan 1, 1999
At the date of observation
Value
Absolute change
Change from previous value
jan 1, 1992
88.136
+88.136
0.0%
jan 1, 1994
76.677
-11.459
-13.0%
jan 1, 1997
100.828
+24.151
31.5%
jan 1, 1998
125.858
+25.03
24.82%
jan 1, 1999
138.147
+12.289
9.76%
jan 1, 2000
127.356
-10.792
-7.81%
jan 1, 2001
85.437
-41.918
-32.91%
jan 1, 2002
95.474
+10.036
11.75%
jan 1, 2003
84.357
-11.117
-11.64%
jan 1, 2004
94.304
+9.947
11.79%
jan 1, 2005
97.88
+3.576
3.79%
jan 1, 2006
82.75
-15.13
-15.46%
jan 1, 2007
61.83
-20.92
-25.28%
jan 1, 2008
63.306
+1.476
2.39%
jan 1, 2009
76.317
+13.011
20.55%
jan 1, 2010
70.645
-5.673
-7.43%
jan 1, 2011
68.16
-2.485
-3.52%
jan 1, 2012
68.835
+0.676
0.99%
jan 1, 2013
71.135
+2.3
3.34%
Ranking of countries by current statistics by years


Comments: