29
/
en
AIzaSyAYiBZKx7MnpbEhh9jyipgxe19OcubqV5w
April 1, 2024
159477
Ireland
IRL
true
2
1
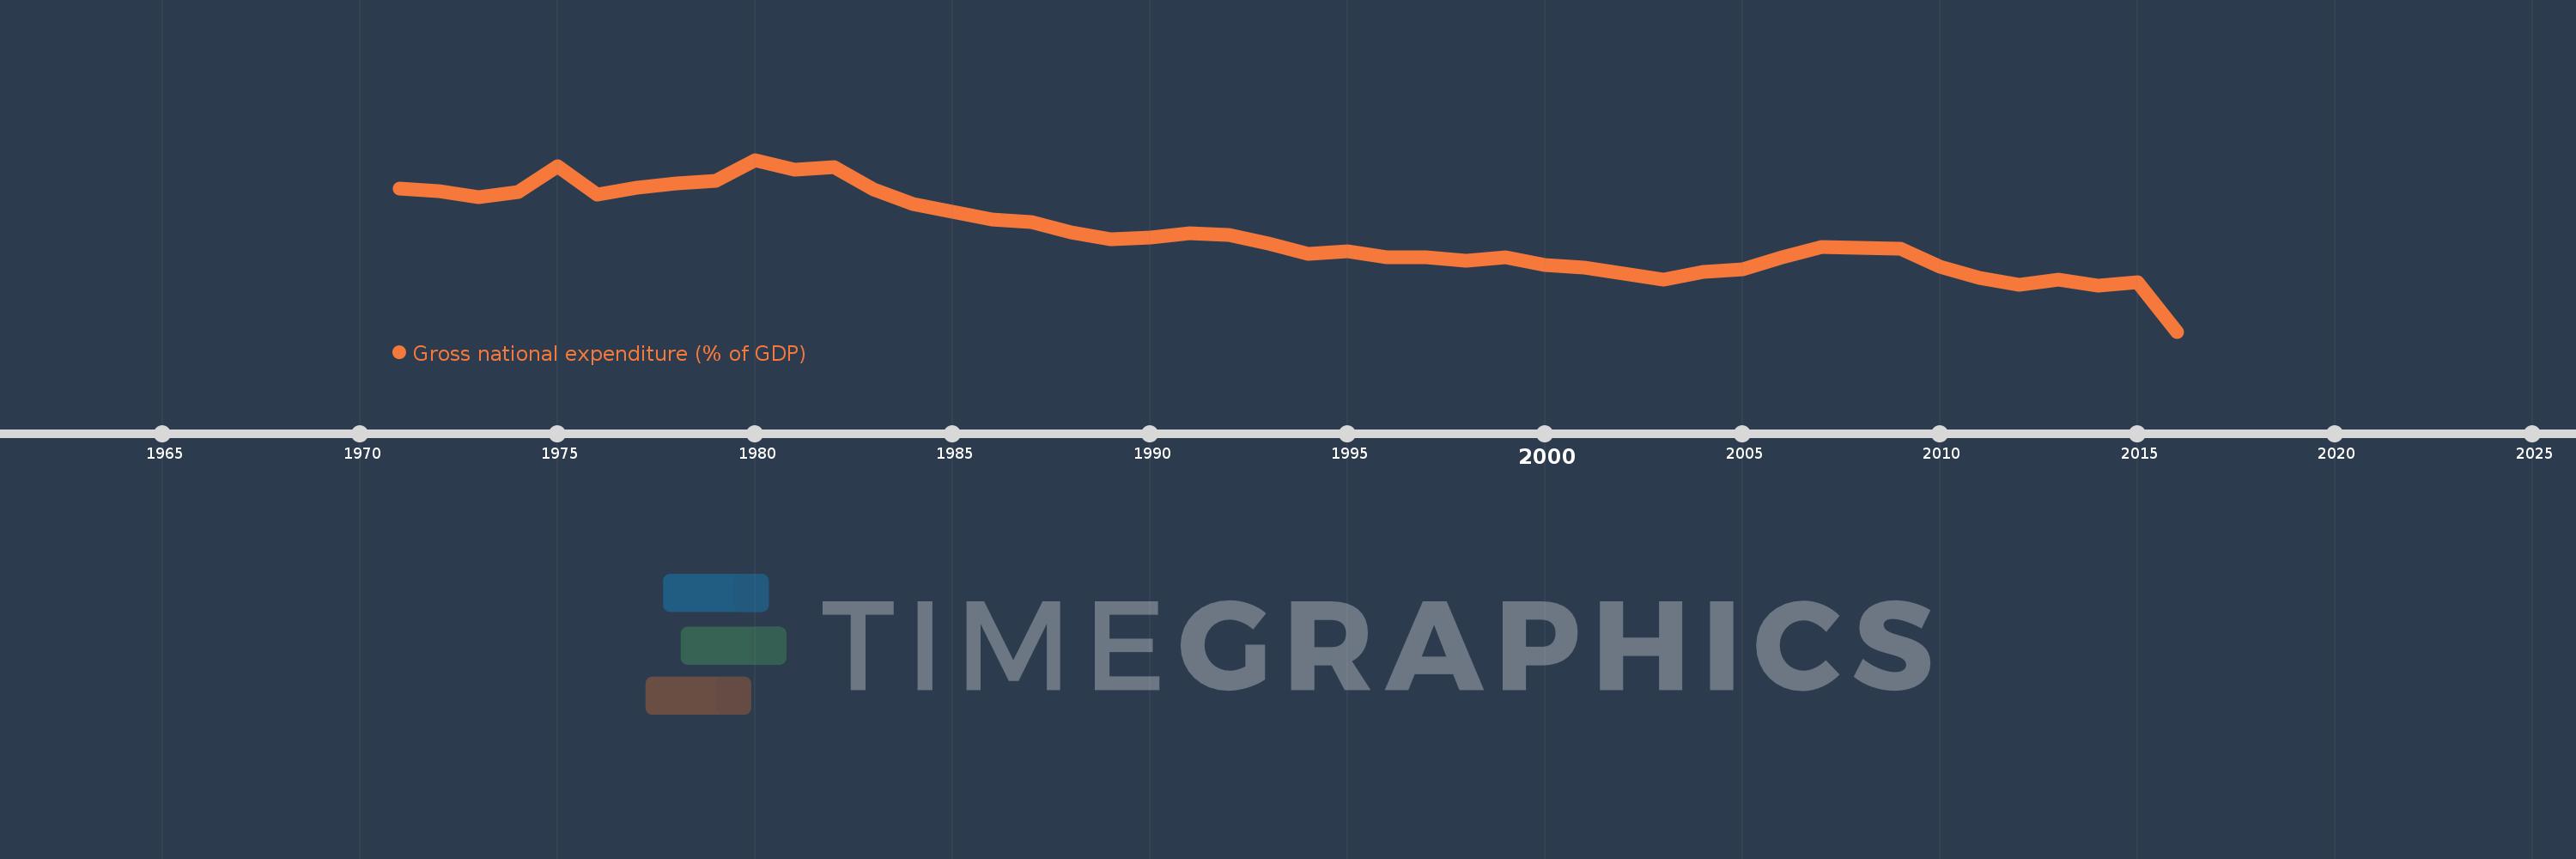
Gross national expenditure (% of GDP)
2016,2015,2014,2013,2012,2011,2010,2009,2008,2007,2006,2005,2004,2003,2002,2001,2000,1999,1998,1997,1996,1995,1994,1993,1992,1991,1990,1989,1988,1987,1986,1985,1984,1983,1982,1981,1980,1979,1978,1977,1976,1975,1974,1973,1972,1971
This statistics in other country:
AfghanistanAlbaniaAlgeriaAngolaAntigua and BarbudaArgentinaArmeniaArubaAustraliaAustriaAzerbaijanBahamas, TheBahrainBangladeshBarbadosBelarusBelgiumBelizeBeninBermudaBhutanBoliviaBosnia and HerzegovinaBotswanaBrazilBrunei DarussalamBulgariaBurkina FasoBurundiCabo VerdeCambodiaCameroonCanadaCentral African RepublicChadChileChinaColombiaComorosCongo, Dem. Rep.Congo, Rep.Costa RicaCote d'IvoireCroatiaCubaCyprusCzech RepublicDenmarkDjiboutiDominicaDominican RepublicEcuadorEgypt, Arab Rep.El SalvadorEquatorial GuineaEritreaEstoniaEthiopiaFaroe IslandsFijiFinlandFranceGabonGambia, TheGeorgiaGermanyGhanaGreeceGrenadaGuatemalaGuineaGuinea-BissauGuyanaHaitiHondurasHong Kong SAR, ChinaHungaryIcelandIndiaIndonesiaIran, Islamic Rep.IraqIrelandIsraelItalyJamaicaJapanJordanKazakhstanKenyaKiribatiKorea, Rep.KosovoKuwaitKyrgyz RepublicLao PDRLatviaLebanonLesothoLiberiaLibyaLithuaniaLuxembourgMacao SAR, ChinaMacedonia, FYRMadagascarMalawiMalaysiaMaldivesMaliMaltaMauritaniaMauritiusMexicoMicronesia, Fed. Sts.MoldovaMongoliaMontenegroMoroccoMozambiqueNamibiaNepalNetherlandsNew CaledoniaNew ZealandNicaraguaNigerNigeriaNorwayOmanPakistanPanamaPapua New GuineaParaguayPeruPhilippinesPolandPortugalPuerto RicoQatarRomaniaRussian FederationRwandaSaudi ArabiaSenegalSerbiaSeychellesSierra LeoneSingaporeSlovak RepublicSloveniaSolomon IslandsSomaliaSouth AfricaSouth SudanSpainSri LankaSt. Kitts and NevisSt. LuciaSt. Vincent and the GrenadinesSudanSurinameSwazilandSwedenSwitzerlandSyrian Arab RepublicTajikistanTanzaniaThailandTimor-LesteTogoTongaTrinidad and TobagoTunisiaTurkeyTurkmenistanUgandaUkraineUnited Arab EmiratesUnited KingdomUnited StatesUruguayUzbekistanVanuatuVenezuela, RBVietnamWest Bank and GazaYemen, Rep.ZambiaZimbabwe Timeline:
This timeline shows a graph from 1971 to 2016 of Ireland. No data until 1970. Number of actual observations by date: 46.
Source name:
World Development Indicators
Source organization:
World Bank national accounts data, and OECD National Accounts data files.
Categories, topics:
Economy & Growth
Last updated:
apr 23, 2017
Indicators value changes by year
Minimum:
68.254
jan 1, 2016
Maximum:
116.261
jan 1, 1980
At the date of observation
Value
Absolute change
Change from previous value
jan 1, 1971
108.234
+108.234
0.0%
jan 1, 1972
107.548
-0.686
-0.63%
jan 1, 1973
105.752
-1.797
-1.67%
jan 1, 1974
107.19
+1.438
1.36%
jan 1, 1975
114.447
+7.257
6.77%
jan 1, 1976
106.596
-7.851
-6.86%
jan 1, 1977
108.41
+1.814
1.7%
jan 1, 1978
109.557
+1.147
1.06%
jan 1, 1979
110.301
+0.744
0.68%
jan 1, 1980
116.261
+5.96
5.4%
jan 1, 1981
113.565
-2.696
-2.32%
jan 1, 1982
114.21
+0.645
0.57%
jan 1, 1983
107.889
-6.321
-5.53%
jan 1, 1984
103.824
-4.065
-3.77%
jan 1, 1985
101.683
-2.141
-2.06%
jan 1, 1986
99.686
-1.997
-1.96%
jan 1, 1987
98.928
-0.758
-0.76%
jan 1, 1988
95.869
-3.06
-3.09%
jan 1, 1989
94.039
-1.829
-1.91%
jan 1, 1990
94.614
+0.575
0.61%
jan 1, 1991
95.621
+1.007
1.06%
jan 1, 1992
95.281
-0.34
-0.36%
jan 1, 1993
92.742
-2.54
-2.67%
jan 1, 1994
89.879
-2.863
-3.09%
jan 1, 1995
90.578
+0.699
0.78%
jan 1, 1996
89.074
-1.504
-1.66%
jan 1, 1997
89.065
-0.009
-0.01%
jan 1, 1998
88.014
-1.051
-1.18%
jan 1, 1999
89.032
+1.018
1.16%
jan 1, 2000
86.752
-2.28
-2.56%
jan 1, 2001
86.16
-0.592
-0.68%
jan 1, 2002
84.376
-1.784
-2.07%
jan 1, 2003
82.815
-1.561
-1.85%
jan 1, 2004
84.848
+2.033
2.45%
jan 1, 2005
85.624
+0.776
0.91%
jan 1, 2006
89.113
+3.489
4.07%
jan 1, 2007
91.957
+2.844
3.19%
jan 1, 2008
91.733
-0.225
-0.24%
jan 1, 2009
91.392
-0.34
-0.37%
jan 1, 2010
86.493
-4.899
-5.36%
jan 1, 2011
83.324
-3.169
-3.66%
jan 1, 2012
81.418
-1.906
-2.29%
jan 1, 2013
82.848
+1.43
1.76%
jan 1, 2014
81.206
-1.642
-1.98%
jan 1, 2015
82.083
+0.877
1.08%
jan 1, 2016
68.254
-13.83
-16.85%
Ranking of countries by current statistics by years


Comments: