29
/
en
AIzaSyAYiBZKx7MnpbEhh9jyipgxe19OcubqV5w
April 1, 2024
153607
Iceland
ISL
true
2
1
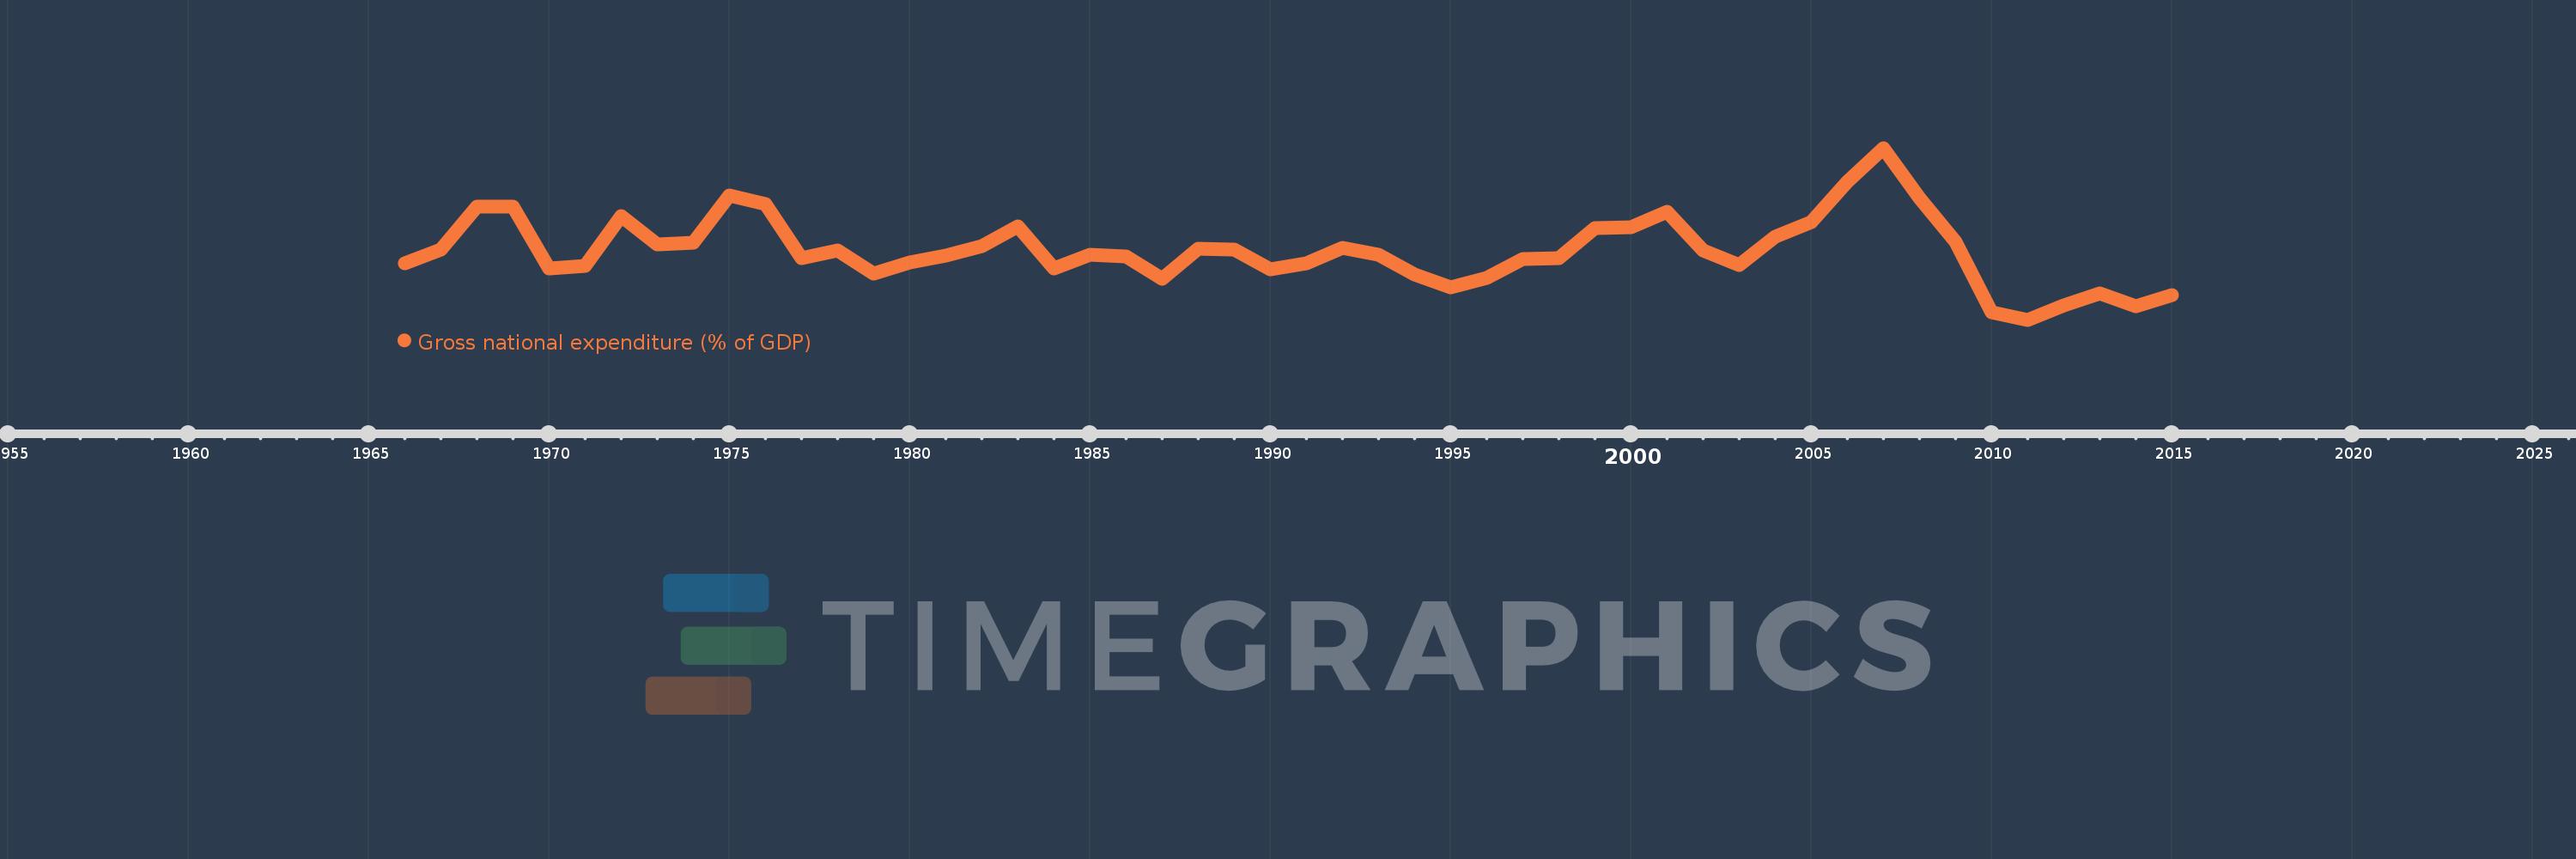
Gross national expenditure (% of GDP)
2015,2014,2013,2012,2011,2010,2009,2008,2007,2006,2005,2004,2003,2002,2001,2000,1999,1998,1997,1996,1995,1994,1993,1992,1991,1990,1989,1988,1987,1986,1985,1984,1983,1982,1981,1980,1979,1978,1977,1976,1975,1974,1973,1972,1971,1970,1969,1968,1967,1966
This statistics in other country:
AfghanistanAlbaniaAlgeriaAngolaAntigua and BarbudaArgentinaArmeniaArubaAustraliaAustriaAzerbaijanBahamas, TheBahrainBangladeshBarbadosBelarusBelgiumBelizeBeninBermudaBhutanBoliviaBosnia and HerzegovinaBotswanaBrazilBrunei DarussalamBulgariaBurkina FasoBurundiCabo VerdeCambodiaCameroonCanadaCentral African RepublicChadChileChinaColombiaComorosCongo, Dem. Rep.Congo, Rep.Costa RicaCote d'IvoireCroatiaCubaCyprusCzech RepublicDenmarkDjiboutiDominicaDominican RepublicEcuadorEgypt, Arab Rep.El SalvadorEquatorial GuineaEritreaEstoniaEthiopiaFaroe IslandsFijiFinlandFranceGabonGambia, TheGeorgiaGermanyGhanaGreeceGrenadaGuatemalaGuineaGuinea-BissauGuyanaHaitiHondurasHong Kong SAR, ChinaHungaryIcelandIndiaIndonesiaIran, Islamic Rep.IraqIrelandIsraelItalyJamaicaJapanJordanKazakhstanKenyaKiribatiKorea, Rep.KosovoKuwaitKyrgyz RepublicLao PDRLatviaLebanonLesothoLiberiaLibyaLithuaniaLuxembourgMacao SAR, ChinaMacedonia, FYRMadagascarMalawiMalaysiaMaldivesMaliMaltaMauritaniaMauritiusMexicoMicronesia, Fed. Sts.MoldovaMongoliaMontenegroMoroccoMozambiqueNamibiaNepalNetherlandsNew CaledoniaNew ZealandNicaraguaNigerNigeriaNorwayOmanPakistanPanamaPapua New GuineaParaguayPeruPhilippinesPolandPortugalPuerto RicoQatarRomaniaRussian FederationRwandaSaudi ArabiaSenegalSerbiaSeychellesSierra LeoneSingaporeSlovak RepublicSloveniaSolomon IslandsSomaliaSouth AfricaSouth SudanSpainSri LankaSt. Kitts and NevisSt. LuciaSt. Vincent and the GrenadinesSudanSurinameSwazilandSwedenSwitzerlandSyrian Arab RepublicTajikistanTanzaniaThailandTimor-LesteTogoTongaTrinidad and TobagoTunisiaTurkeyTurkmenistanUgandaUkraineUnited Arab EmiratesUnited KingdomUnited StatesUruguayUzbekistanVanuatuVenezuela, RBVietnamWest Bank and GazaYemen, Rep.ZambiaZimbabwe Timeline:
This timeline shows a graph from 1966 to 2015 of Iceland. No data until 1965. Number of actual observations by date: 50.
Source name:
World Development Indicators
Source organization:
World Bank national accounts data, and OECD National Accounts data files.
Categories, topics:
Economy & Growth
Last updated:
apr 23, 2017
Indicators value changes by year
Minimum:
89.789
jan 1, 2011
Maximum:
117.167
jan 1, 2007
At the date of observation
Value
Absolute change
Change from previous value
jan 1, 1966
98.722
+98.722
0.0%
jan 1, 1967
101.013
+2.291
2.32%
jan 1, 1968
107.808
+6.796
6.73%
jan 1, 1969
107.805
-0.004
0.0%
jan 1, 1970
97.956
-9.848
-9.14%
jan 1, 1971
98.372
+0.416
0.42%
jan 1, 1972
106.338
+7.966
8.1%
jan 1, 1973
101.793
-4.545
-4.27%
jan 1, 1974
102.035
+0.242
0.24%
jan 1, 1975
109.53
+7.495
7.35%
jan 1, 1976
108.215
-1.314
-1.2%
jan 1, 1977
99.671
-8.544
-7.9%
jan 1, 1978
100.795
+1.124
1.13%
jan 1, 1979
97.141
-3.654
-3.63%
jan 1, 1980
98.907
+1.766
1.82%
jan 1, 1981
100.035
+1.128
1.14%
jan 1, 1982
101.48
+1.445
1.44%
jan 1, 1983
104.654
+3.174
3.13%
jan 1, 1984
97.931
-6.723
-6.42%
jan 1, 1985
100.086
+2.155
2.2%
jan 1, 1986
99.88
-0.206
-0.21%
jan 1, 1987
96.276
-3.604
-3.61%
jan 1, 1988
101.059
+4.783
4.97%
jan 1, 1989
100.914
-0.145
-0.14%
jan 1, 1990
97.838
-3.076
-3.05%
jan 1, 1991
98.766
+0.928
0.95%
jan 1, 1992
101.251
+2.485
2.52%
jan 1, 1993
100.12
-1.131
-1.12%
jan 1, 1994
96.952
-3.168
-3.16%
jan 1, 1995
95.01
-1.942
-2.0%
jan 1, 1996
96.517
+1.508
1.59%
jan 1, 1997
99.46
+2.943
3.05%
jan 1, 1998
99.541
+0.081
0.08%
jan 1, 1999
104.369
+4.827
4.85%
jan 1, 2000
104.548
+0.179
0.17%
jan 1, 2001
106.968
+2.42
2.31%
jan 1, 2002
100.88
-6.087
-5.69%
jan 1, 2003
98.459
-2.421
-2.4%
jan 1, 2004
102.993
+4.534
4.6%
jan 1, 2005
105.371
+2.378
2.31%
jan 1, 2006
111.836
+6.464
6.13%
jan 1, 2007
117.167
+5.332
4.77%
jan 1, 2008
109.171
-7.996
-6.82%
jan 1, 2009
102.205
-6.966
-6.38%
jan 1, 2010
90.972
-11.232
-10.99%
jan 1, 2011
89.789
-1.183
-1.3%
jan 1, 2012
92.037
+2.248
2.5%
jan 1, 2013
93.976
+1.939
2.11%
jan 1, 2014
91.967
-2.01
-2.14%
jan 1, 2015
93.74
+1.773
1.93%
Ranking of countries by current statistics by years


Comments: