29
/
en
AIzaSyAYiBZKx7MnpbEhh9jyipgxe19OcubqV5w
April 1, 2024
219640
Papua New Guinea
PNG
true
2
1
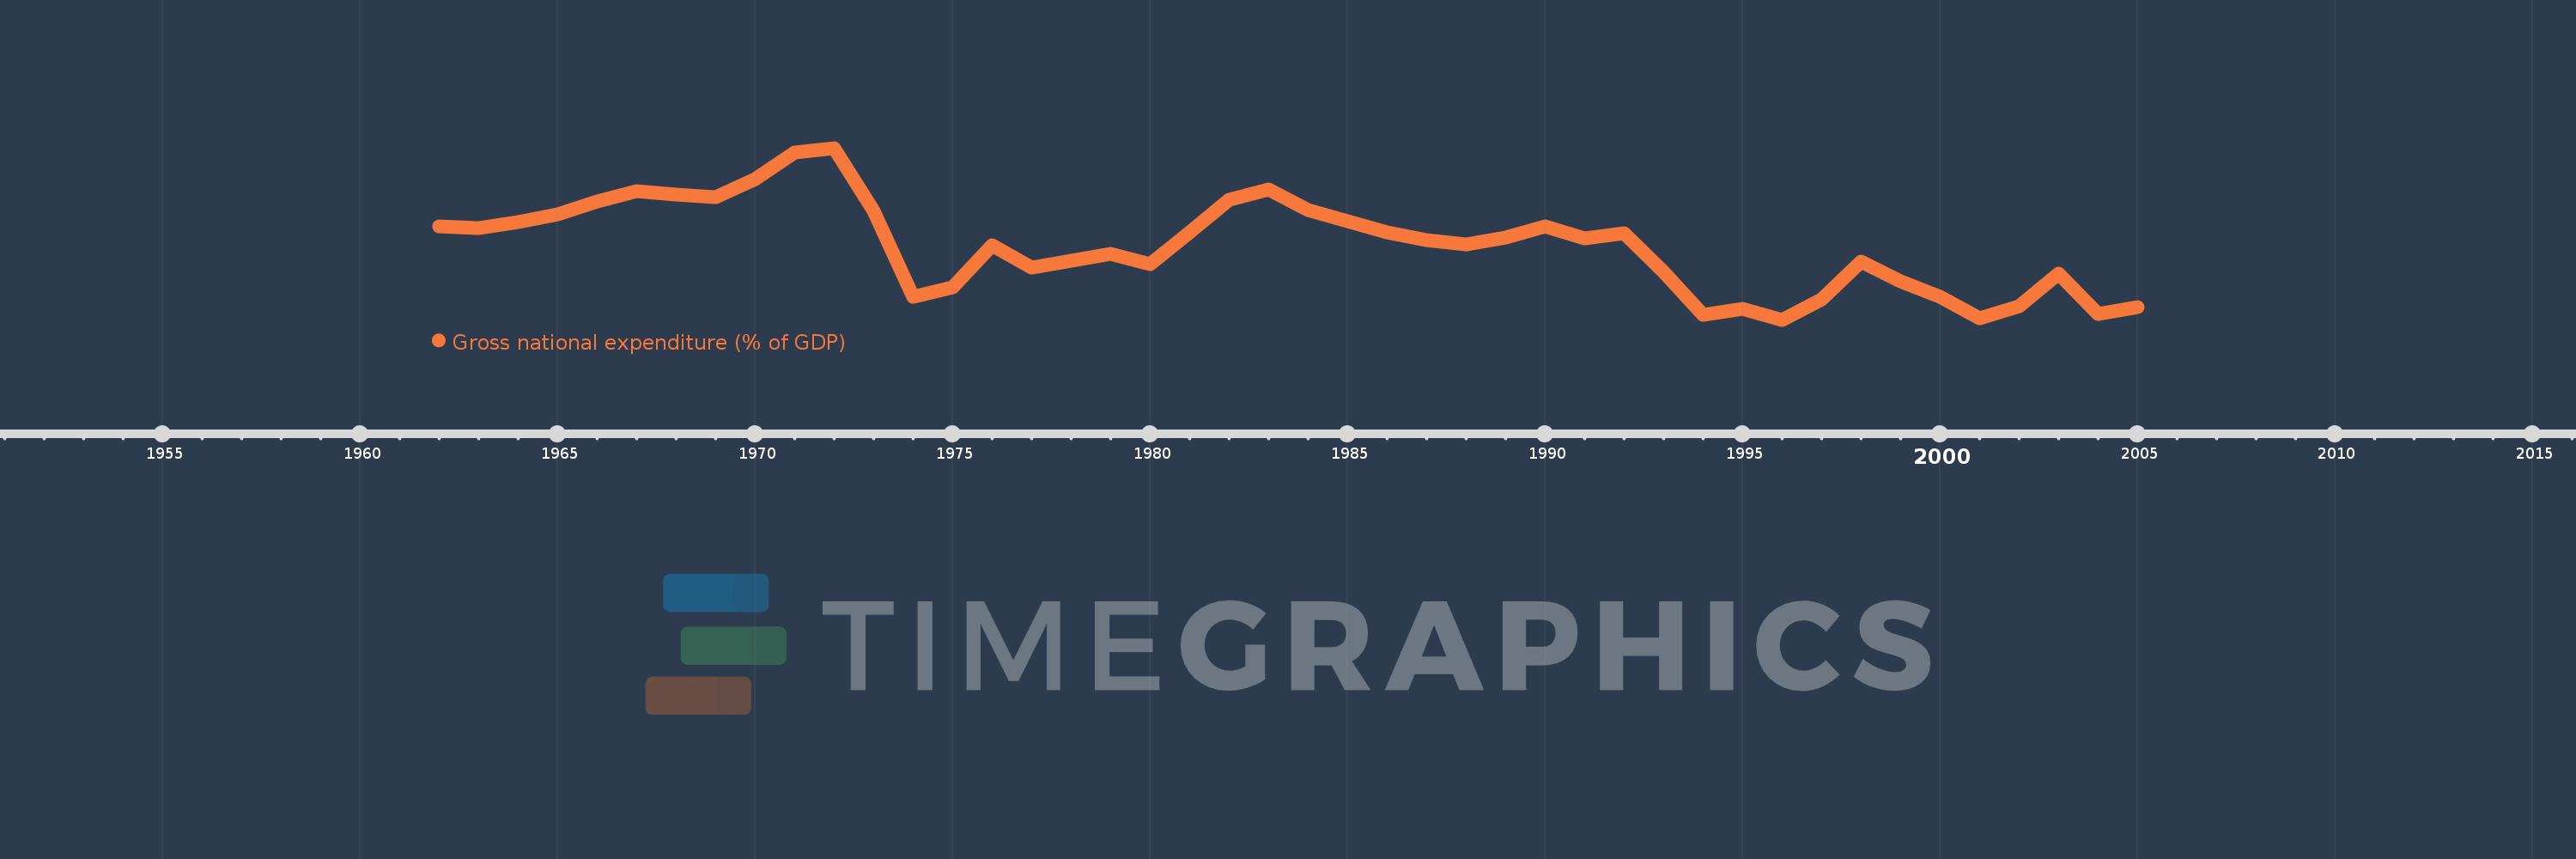
Gross national expenditure (% of GDP)
2005,2004,2003,2002,2001,2000,1999,1998,1997,1996,1995,1994,1993,1992,1991,1990,1989,1988,1987,1986,1985,1984,1983,1982,1981,1980,1979,1978,1977,1976,1975,1974,1973,1972,1971,1970,1969,1968,1967,1966,1965,1964,1963,1962
This statistics in other country:
AfghanistanAlbaniaAlgeriaAngolaAntigua and BarbudaArgentinaArmeniaArubaAustraliaAustriaAzerbaijanBahamas, TheBahrainBangladeshBarbadosBelarusBelgiumBelizeBeninBermudaBhutanBoliviaBosnia and HerzegovinaBotswanaBrazilBrunei DarussalamBulgariaBurkina FasoBurundiCabo VerdeCambodiaCameroonCanadaCentral African RepublicChadChileChinaColombiaComorosCongo, Dem. Rep.Congo, Rep.Costa RicaCote d'IvoireCroatiaCubaCyprusCzech RepublicDenmarkDjiboutiDominicaDominican RepublicEcuadorEgypt, Arab Rep.El SalvadorEquatorial GuineaEritreaEstoniaEthiopiaFaroe IslandsFijiFinlandFranceGabonGambia, TheGeorgiaGermanyGhanaGreeceGrenadaGuatemalaGuineaGuinea-BissauGuyanaHaitiHondurasHong Kong SAR, ChinaHungaryIcelandIndiaIndonesiaIran, Islamic Rep.IraqIrelandIsraelItalyJamaicaJapanJordanKazakhstanKenyaKiribatiKorea, Rep.KosovoKuwaitKyrgyz RepublicLao PDRLatviaLebanonLesothoLiberiaLibyaLithuaniaLuxembourgMacao SAR, ChinaMacedonia, FYRMadagascarMalawiMalaysiaMaldivesMaliMaltaMauritaniaMauritiusMexicoMicronesia, Fed. Sts.MoldovaMongoliaMontenegroMoroccoMozambiqueNamibiaNepalNetherlandsNew CaledoniaNew ZealandNicaraguaNigerNigeriaNorwayOmanPakistanPanamaPapua New GuineaParaguayPeruPhilippinesPolandPortugalPuerto RicoQatarRomaniaRussian FederationRwandaSaudi ArabiaSenegalSerbiaSeychellesSierra LeoneSingaporeSlovak RepublicSloveniaSolomon IslandsSomaliaSouth AfricaSouth SudanSpainSri LankaSt. Kitts and NevisSt. LuciaSt. Vincent and the GrenadinesSudanSurinameSwazilandSwedenSwitzerlandSyrian Arab RepublicTajikistanTanzaniaThailandTimor-LesteTogoTongaTrinidad and TobagoTunisiaTurkeyTurkmenistanUgandaUkraineUnited Arab EmiratesUnited KingdomUnited StatesUruguayUzbekistanVanuatuVenezuela, RBVietnamWest Bank and GazaYemen, Rep.ZambiaZimbabwe Timeline:
This timeline shows a graph from 1962 to 2005 of Papua New Guinea. No data until 1961. Number of actual observations by date: 44.
Source name:
World Development Indicators
Source organization:
World Bank national accounts data, and OECD National Accounts data files.
Categories, topics:
Economy & Growth
Last updated:
apr 23, 2017
Indicators value changes by year
Minimum:
82.662
jan 1, 1996
Maximum:
136.869
jan 1, 1972
At the date of observation
Value
Absolute change
Change from previous value
jan 1, 1962
112.031
+112.031
0.0%
jan 1, 1963
111.707
-0.324
-0.29%
jan 1, 1964
113.555
+1.849
1.65%
jan 1, 1965
115.994
+2.439
2.15%
jan 1, 1966
119.948
+3.954
3.41%
jan 1, 1967
123.346
+3.398
2.83%
jan 1, 1968
122.262
-1.084
-0.88%
jan 1, 1969
121.214
-1.047
-0.86%
jan 1, 1970
126.981
+5.767
4.76%
jan 1, 1971
135.461
+8.481
6.68%
jan 1, 1972
136.869
+1.407
1.04%
jan 1, 1973
117.041
-19.828
-14.49%
jan 1, 1974
89.942
-27.099
-23.15%
jan 1, 1975
92.957
+3.015
3.35%
jan 1, 1976
106.185
+13.228
14.23%
jan 1, 1977
99.007
-7.178
-6.76%
jan 1, 1978
101.294
+2.287
2.31%
jan 1, 1979
103.483
+2.189
2.16%
jan 1, 1980
100.11
-3.373
-3.26%
jan 1, 1981
110.14
+10.03
10.02%
jan 1, 1982
120.503
+10.363
9.41%
jan 1, 1983
123.662
+3.159
2.62%
jan 1, 1984
117.256
-6.407
-5.18%
jan 1, 1985
113.703
-3.553
-3.03%
jan 1, 1986
110.325
-3.377
-2.97%
jan 1, 1987
107.775
-2.55
-2.31%
jan 1, 1988
106.506
-1.269
-1.18%
jan 1, 1989
108.672
+2.166
2.03%
jan 1, 1990
112.099
+3.427
3.15%
jan 1, 1991
108.322
-3.777
-3.37%
jan 1, 1992
109.89
+1.568
1.45%
jan 1, 1993
97.852
-12.038
-10.95%
jan 1, 1994
84.303
-13.549
-13.85%
jan 1, 1995
86.233
+1.931
2.29%
jan 1, 1996
82.662
-3.571
-4.14%
jan 1, 1997
88.994
+6.332
7.66%
jan 1, 1998
100.893
+11.899
13.37%
jan 1, 1999
94.778
-6.115
-6.06%
jan 1, 2000
89.77
-5.008
-5.28%
jan 1, 2001
83.065
-6.705
-7.47%
jan 1, 2002
86.92
+3.855
4.64%
jan 1, 2003
97.087
+10.167
11.7%
jan 1, 2004
84.613
-12.474
-12.85%
jan 1, 2005
86.755
+2.142
2.53%
Ranking of countries by current statistics by years


Comments: